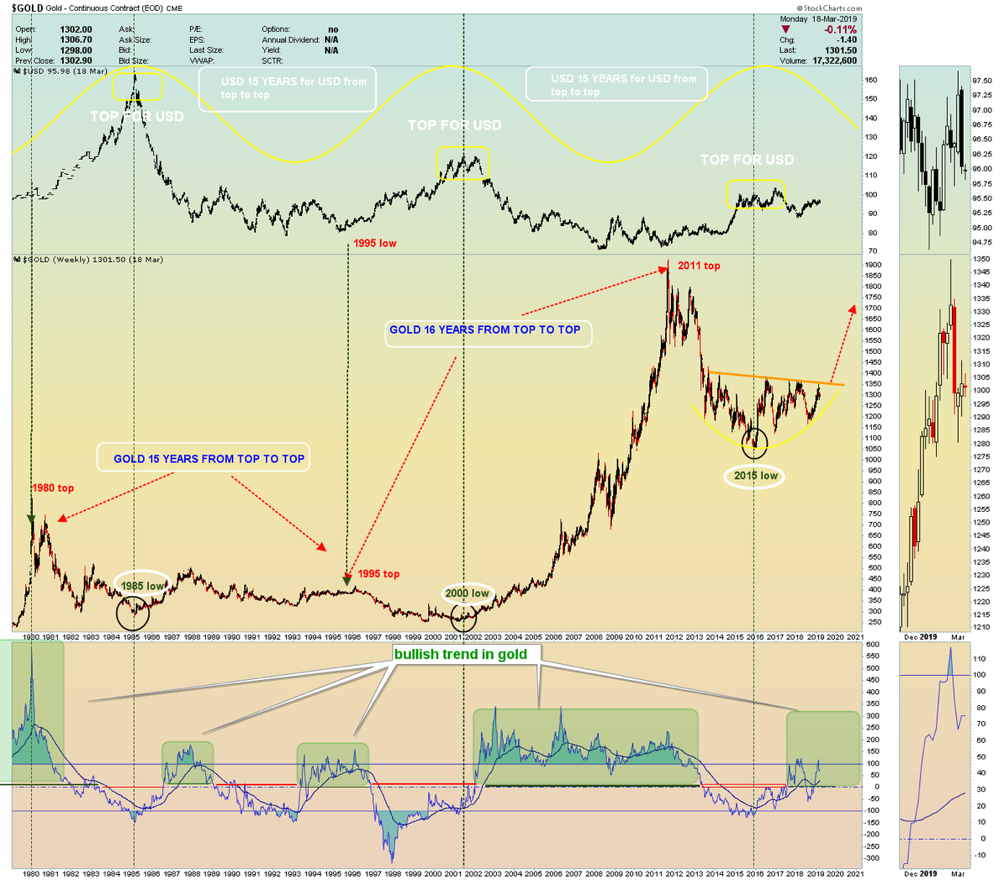
Since the 1980s, gold has a cyclicity that develops with a 15 year-old periodicity among the tops: beginning from 1980 (1st top) after 15 years we had the 1995 followed by the top of 2011.
At the same time the dollar made, in a mirror pattern, some movements with a series of 15 year-old alternate low: while gold was on the maximum in 1980 the US dollar made a minimum. Same speech in 1995 with the dollar that reached extremely low levels. In 2011 the dollar made a retest of the low. Opposite situation in the phases of top of the US Dollar: at the 1985 top, at the 2000 top and at the 2015 top, gold touched new lows. The actual phase of accumulation seems therefore to be close to the end with a new bullish leg head. The breakout of the horizontal red line (resistance) would be a first strong signal that gold is ready to start to the upside (meanwhile the US dollar is expected to fall). Indicators suggest that the health status of gold is OK.
Reproduction, in whole or in part, is authorized as long as it includes all the text hyperlinks and a link back to the original source.
The information contained in this article is for information purposes only and does not constitute investment advice or a recommendation to buy or sell.


