In a previous post, we’ve seen that when your clients live in the euro zone, they have to track the price of gold inAs a wealth management advisor, substituting the easy solution of acquiring gold mining shares to physical gold – whether within a life insurance policy or with an ordinary account – would be a mistake euro – not in US dollars. Only then – when one looks at the price of the yellow metal in the local currency – can one appreciate the financial properties of this wealth insurance.
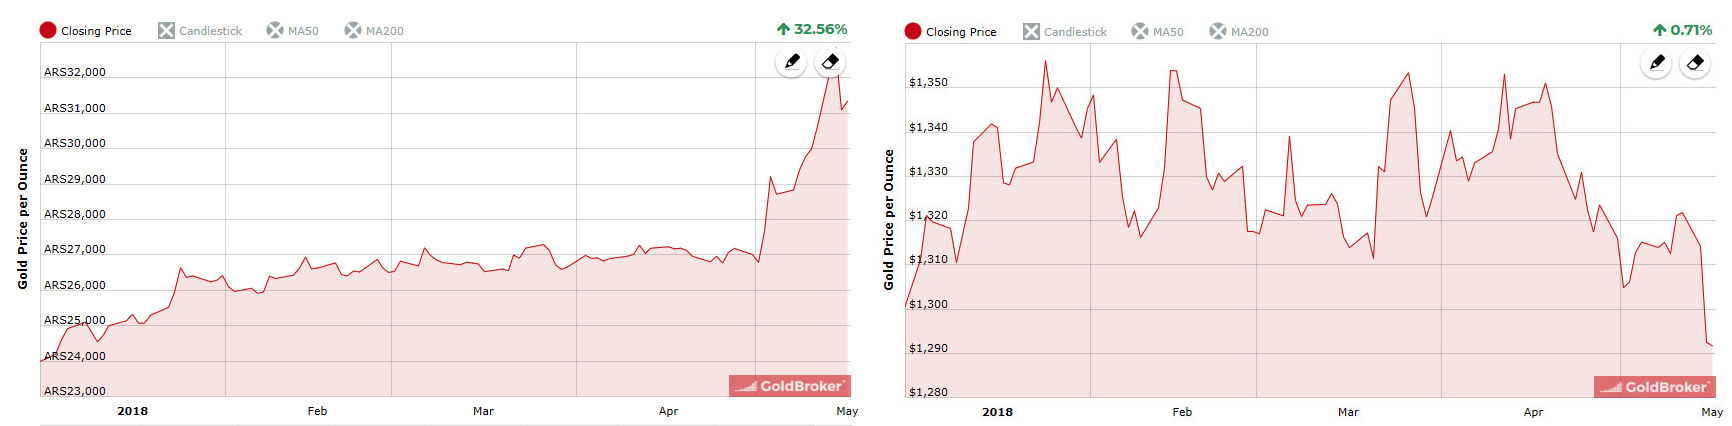
As we were reminded by recent news, it wouldn’t make a lot of sense for an Argentine saver to track the price of gold in US dollars. Since his wealth and his revenues are denominated in Argentine pesos, senior Garcia must look at the price of gold in that currency. A 32% performance since January 1st isn’t exactly the same thing as 0.71%, right?
Spot gold in Argentine pesos (ARS) vs spot gold in US dollars (USD) since January 1st, 2018
But today, I’d like to talk about another topic entirely: Is a position on gold miners similar to the buying of physical gold?
Gold products and financial goals
If you read my previous post, you may have noticed that Thi Hong Van Hoang, in her doctorate thesis, made some distinctions between "physical gold, paper gold and gold mining stocks".
As I wrote in my book, “Since all gold products do not have the same characteristics in terms of risk, yield, liquidity and security, (everything) depends on your (or your clients’) financial goals”.
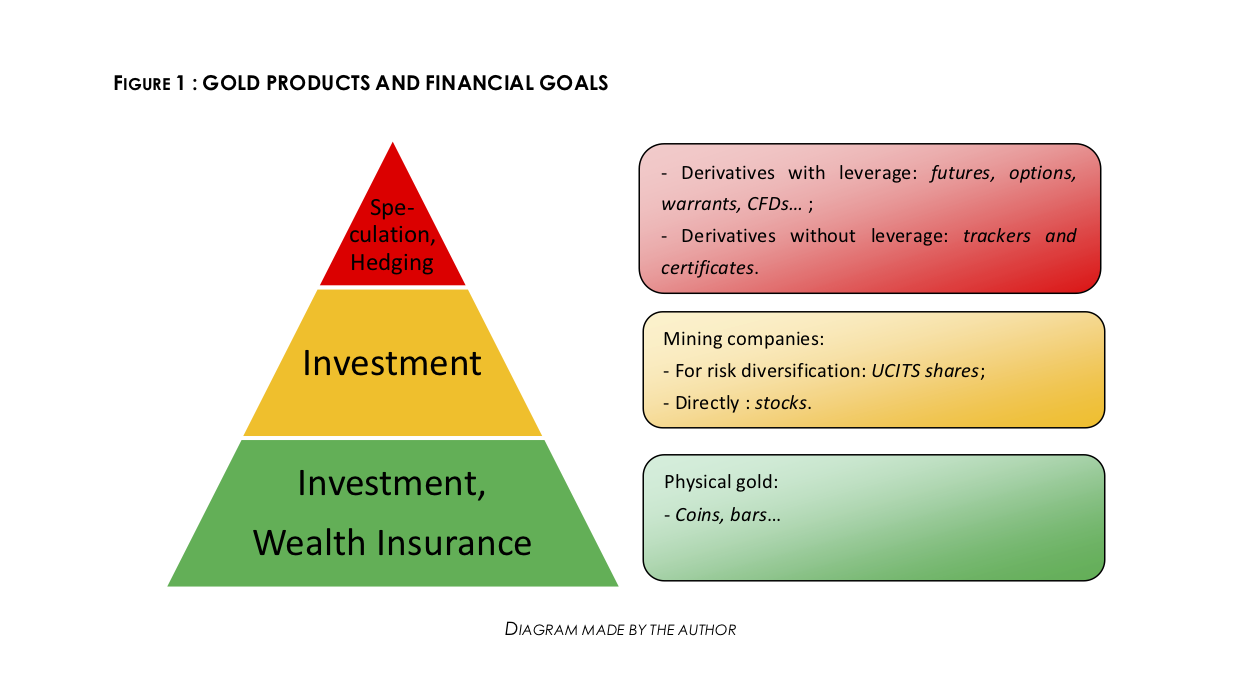
When one wants to protect wealth against risks of conjectural and, a fortiori, structural instability, one must go toward physical gold. As a wealth management advisor, substituting the easy solution of acquiring gold mining shares to physical gold – whether within a life insurance policy or with an ordinary account – would be a mistake.
But, of course, you don’t have to take my word for it... I will then try to prove it to you.
How have the miners compared to the ounce of gold these last 20 years?
The two main benchmark indices for miners globally are the Philadelphia Gold and Silver Index (XAU) and the NYSE Arca Gold Bugs Index (HUI). The former is an index that measures the performance of gold mining companies listed on the Philadelphia Stock Exchange. The latter measures the performance of companies listed on the New York American Stock Exchange. Without getting into details, let’s just say that those two indices share many miners and are calculated quite differently.
Since said indices are quoted in US dollars, we’ll make an exception and compare them to the spot price of gold in US dollars.
Gold spot price in US dollars (brown curve), HUI (yellow curve) and XAU (orange curve)
(10/1997 – 05/2018)

As you can see, for the whole 1997-2018 period, the value of the ounce of gold has been multiplied almost by four, whereas the miners indices only show a 13% performance for the HUI and -25% for the XAU.
True, there has been a golden period for the miners between 2001 and 2008: in those seven years, the HUI performed much better than the ounce of gold.
However, at its September 2011 peak, the ounce of gold in US dollars had gained 450% since the end of 1997, whereas the HUI “only” gained 300%, while the XAU gained a little over 80%.
Lastly, a saver who would have taken a position on gold at its peak in US dollars in September, 2011 would only have seen the value of his position decline by 20%, whereas an equivalent position on the XAU would have lost more than half.
Spot gold in US dollars (green and red curve) vs XAU (blue and gray curve)
(10/2010 – 05/2018, 100 basis at September 5, 2011)
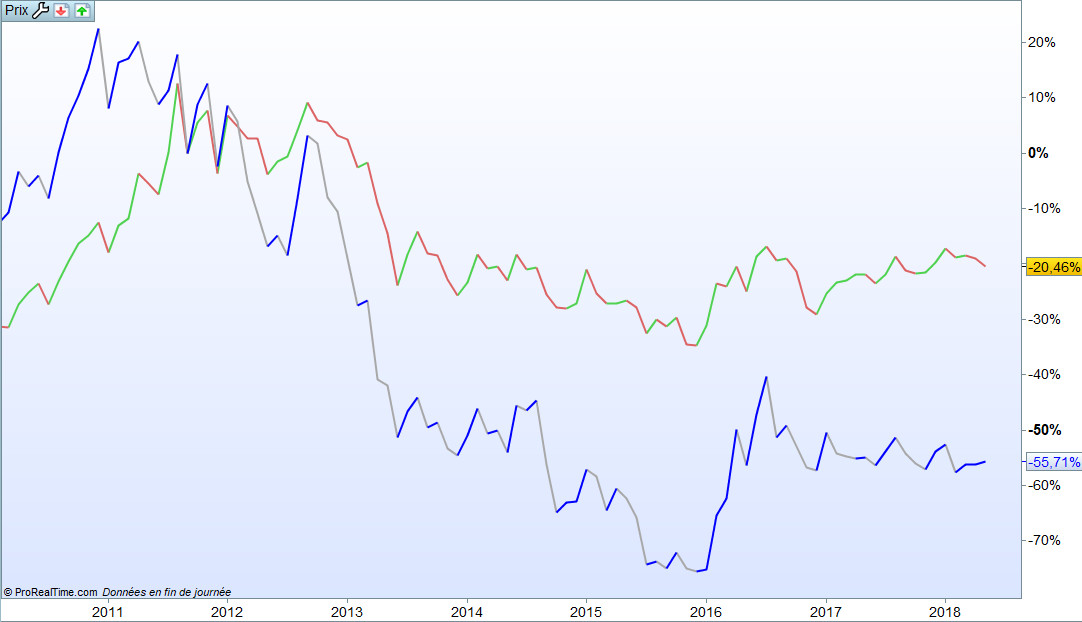
(Source : ProRealTime)
That certainly puts into question the famous “leverage” associated with the miners, doesn’t it?
The miners are certainly correlated to physical gold, but they are much more volatile
As I indicate in my book, “Over the long term, mining stocks prices do correlate with the price of the yellow metal. However, the evolution in indices such as XAU or HUI shows that the miners come with a much more exacerbated volatility than the ounce of gold. Miners have globally outperformed the yellow metal from 2001 to 2008, when they brutally dropped”. They have then picked up from 2009 to 2011 before plunging again to the same level they were at... fifteen years ago!
To sum up, “One would have had to own a portfolio of very well chosen stocks to outperform physical gold over time. But selecting gold mining companies has become a specialist’s job. The leverage usually associated with the miners has variable geometry and puts into question the buy-and-hold strategy that allowed gains on this market between 2001 and 2008. Investing in gold mining companies today calls for more frequent changes in positioning”.
A different nature: gold mining shares are first and foremost... stocks!
To the risk of being redundant, gold mining shares are first and foremost stocks. If their acquisition has a rightful place in a wealth building strategy, it must be seen in an investment perspective rather than as a way to protect one’s wealth from a catastrophe.
In fact, gold mining shares offer some yield through dividends, which gold coins and bars do not do. However, contrary to physical gold which very long-term value is around 500 $ per ounce, stocks may lead an investor to the risk of a 100% loss.
Yannick Colleu, author and precious metals specialist, puts it in perfect perspective when he writes that, “gold mining shares have the weaknesses of both gold and stocks without having any of either’s strengths”. It goes without saying that this asset class should be reserved for experts who will be able to identify the nuggets and/or take a position (in or out!) in a miner at the right time.
Finally, gold mining shares cannot be put on the same scale as physical gold, which is the only gold asset that constitutes real wealth insurance. And it must not be confounded with “paper gold”, as we shall see in the very near future.
Reproduction, in whole or in part, is authorized as long as it includes all the text hyperlinks and a link back to the original source.
The information contained in this article is for information purposes only and does not constitute investment advice or a recommendation to buy or sell.


