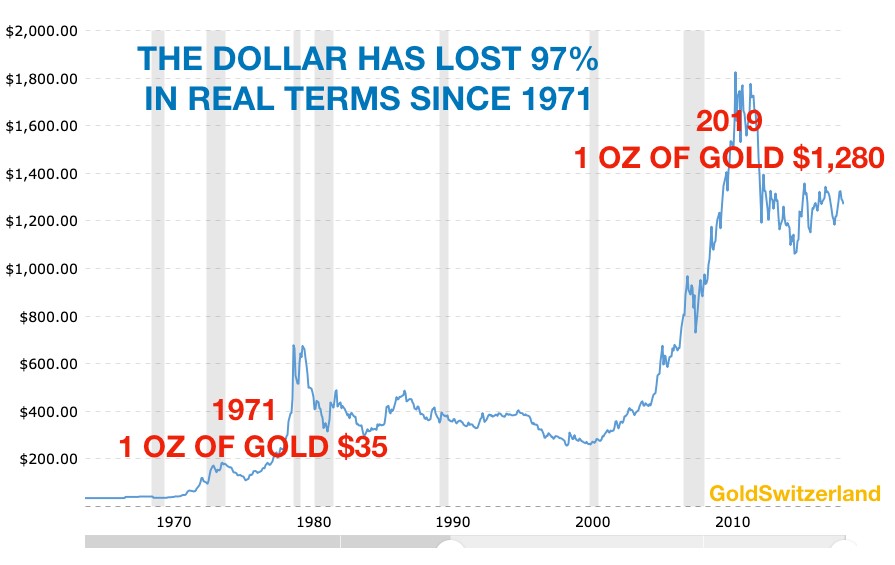
My long standing target for gold of $10,000 in today’s money and much, much higher in inflationary terms, is now more probable than ever. But I hope it will never be achieved. When gold goes to $10,000, it won’t be under the same circumstances that we saw in the 1970s. Gold then went from $35 in 1971 to $850 in January 1980 – a 24x explosion in very different conditions.
In the 1970s we had high inflation, weakening currencies and recessions in most countries. I remember the time well. I lived in the UK and experienced in those days a global oil crisis, a coal miners’ strike and shortages of various products. In 1974, businesses could only operate with electricity for three days per week. I was involved in retailing with Dixons which later became the UK’s biggest consumer electronics retailer and a FTSE 100 company. We sold televisions and other electric products with candle light. The Dixons’ share price went down 94% (and so did my first options) although the company was always profitable and well financed. My first mortgage went to 21% for a period.
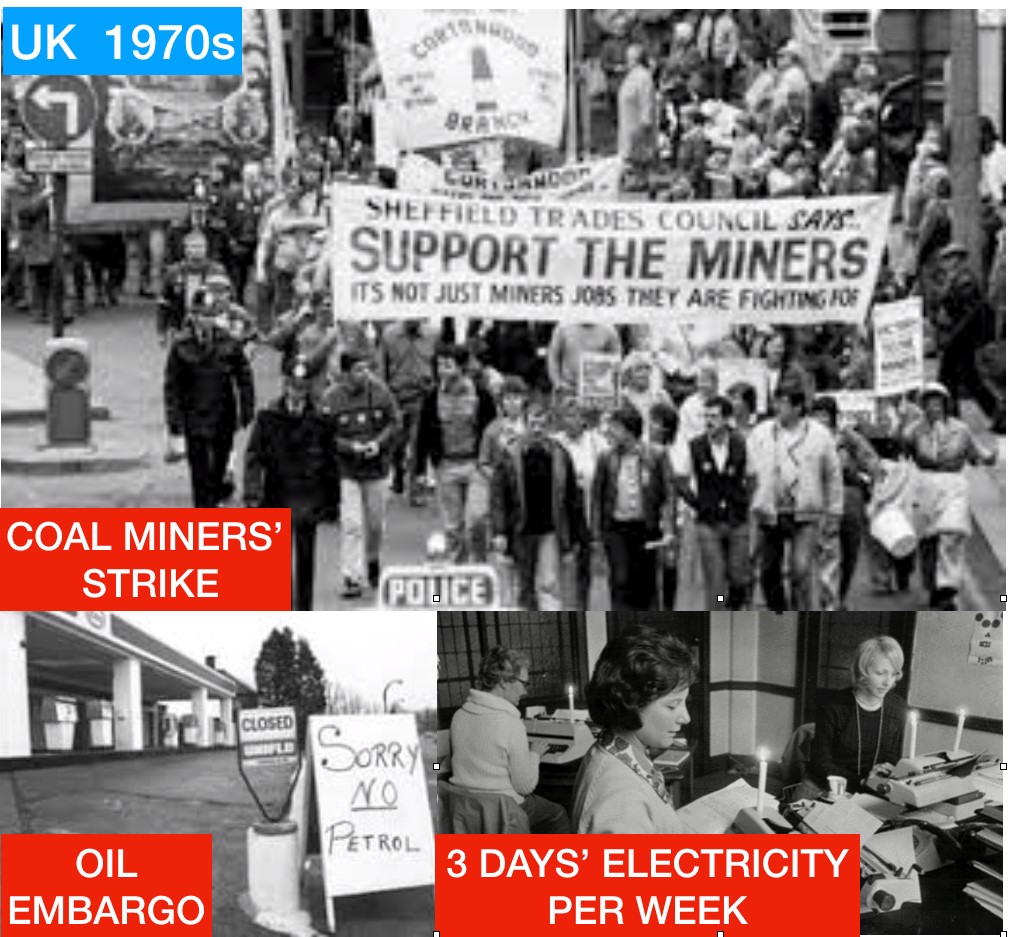
UK 1970S – A SERIES OF CRISIS
I was fortunate to learn early what could happen to a country’s economy. Times were hard but there was no depression and most people had a job. What we must remember is that in August 1971 Nixon took away the gold backing of the dollar and that opened the floodgates for the credit creation and money printing that we are now in the final stages of. Gold’s massive surge in the 70s was primarily caused by double digit inflation and currency debasement.
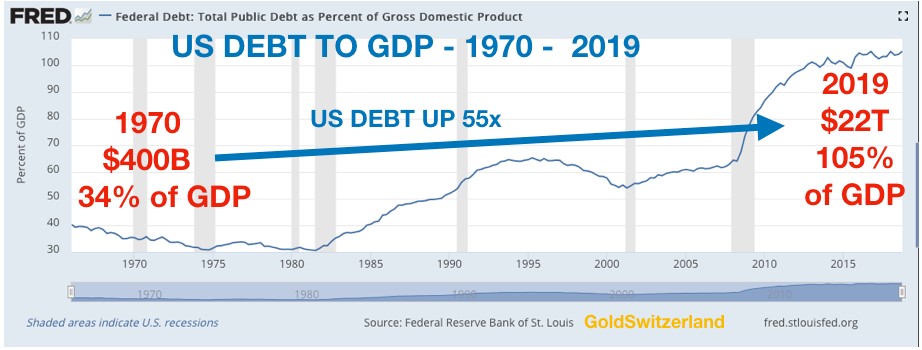
US DEBT UP 55X
US debt in 1971 was $400 billion which was 34% of GDP. Today US debt is 55x greater at $22 trillion and 105% of GDP.
Since 1971 the dollar has lost 97% in purchasing power and even at today’s level, the dollar is massively overvalued.
Although I sincerely hope that gold will not reach $10,000 or above, I am absolutely convinced that this is very likely to happen. This next time a much higher gold price will not just reflect inflation and falling currencies like in the 1970s but a much more serious or even catastrophic situation both in the US and globally.
So let’s look at a potential scenario for the next few years. This is obviously not a forecast but more of a rough sketch of what we could happen:
$300 IN 2002 TO $1,920 IN 2011 WAS JUST THE FIRST LEG
I will start by sticking my neck out. I know forecasting is very dangerous and a mug’s game. Since 2001, I have been right about the risks in the world and gold’s role to protect against these risks. Early in 2002 we entered the physical gold market in a substantial way for ourselves and the people we advised. The ride from $300 in 2002 to $1,920 in 2011 was spectacular. But the gold price rise was just a confirmation of the risks that we had identified which led to the 2007-9 financial crisis. The world financial system was minutes away from going under in 2008 but was saved with tens of trillions of printed money issued by the Fed and other central banks around the world.
This did not save the world but postponed the eventual collapse. What you learn after a long life of experiences at all levels is that things take longer than you think. There is always a danger to believe that when you see a major problem in the economy that it will materialise very quickly. We have now learnt that things can take a lot longer than you expect. Thus patience is a very important virtue that is learnt from a long life of experiences.
Today over 10 years have passed since the culmination of the Great Financial Crisis. The optimism is as great as ever. Stock, bond and property markets are at, or near, their highs. But the world has learnt nothing. The cause of the problem in 2007-9 was debt in various forms, including derivatives and today, with global debt having doubled since 2006, the risk position is exponentially more explosive. Also, the gold price has not yet reflected all the recent money printing.
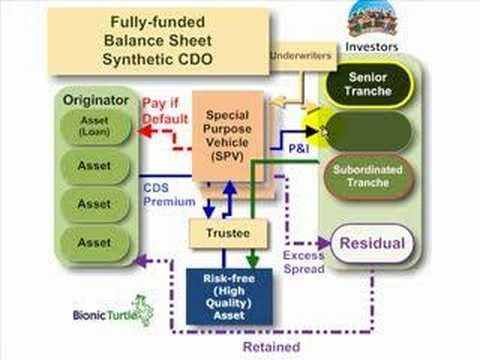
THE TRIGGER FOR THE 2007-9 CRISIS – SYNTHETIC CDOS – IS BACK AGAIN
The trigger last time was derivatives on mortgage debt. But clearly the world has a short memory since the synthetic CDO market (Collateralised Debt Obligations) is back with a vengeance. US synthetic CDOs have grown 40% this year. This time the CDOs are not on mortgages but on corporate debt. That market is considered a lot safer than the mortgage CDOs according to the issuers which are banks like Citigroup, Barclays, BNP Paribas and Societe Generale.
Well that’s what they always say. But if we look at corporate debt, it is today at an all time high against GDP at 73% up from 45% in 1971.The synthetic CDO is a highly leveraged instrument that can involve multiple bets on the same loans.
So, these CDOs are just another example of “the more it changes, the more it stays the same”.
In other words, global debt is at an all-time high and the dangerous derivatives we saw last time are back again.
2007-9 WAS A REHEARSAL – THE REAL EVENT IS STILL TO COME
The 2007-9 crisis was only a rehearsal for what we are to see next. The rubber band is now stretched to a maximum and there are bubbles everywhere. Just like the world on the surface seems to have been functioning for ten years since the crisis, why couldn’t this continue for another ten years? Yes, in theory it could but at some stage we will reach the point when that little boy calls out “the Emperor has no clothes”. There is clearly a limit to how long the laws of nature can be broken and how long the world can live on air or manufactured money that has zero value since it has been created without any counter-performance.
But as we have experienced, bubbles can last a lot longer than we expect. Technical analysis can sometimes be useful to time market turns but that is of course not fool proof either. Nevertheless, 2019 from many aspects, both fundamental and technical, looks like the year when we could experience a turn in markets and the world economy.
Our proprietary long term cycle system points towards a potential top in the US stock market in May. The same system did forecast the Aug-Sep 2011 top in gold two years in advance. A cycle system can of course never predict the magnitude of the turn. Interestingly, the brilliant technical analyst Bob McHugh (Technical Indicator Index) also has a turning point for the stock market around mid-May. So middle of May could be an important time for a stock market turn. But even if this cycle point turns out to be nothing, global stock markets are very likely to start their long term secular down trend sometime in 2019.
GOLD AND SILVER GETTING READY FOR LAUNCH
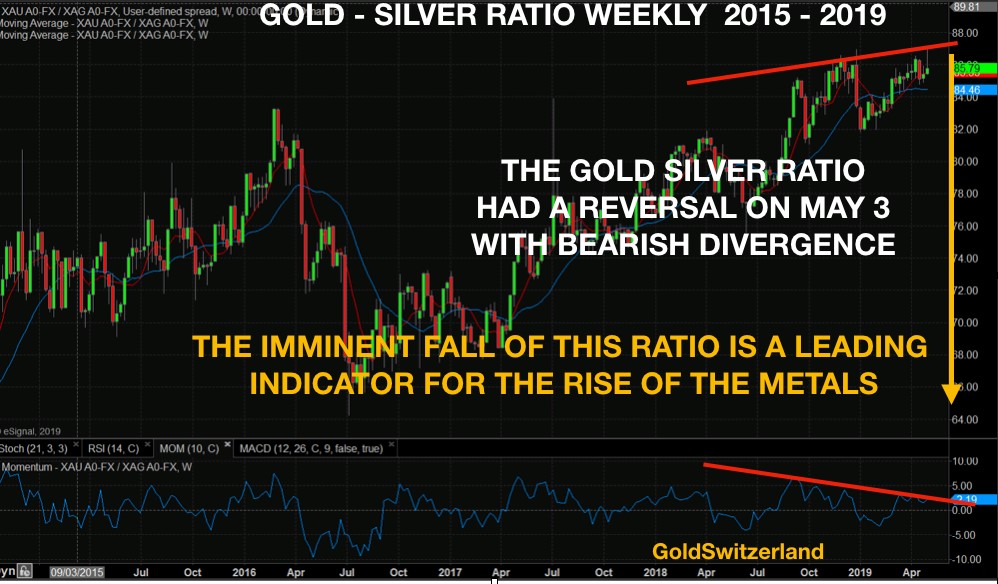
Gold and silver are finalising their correction now. We might have seen the correction lows already. If not they should happen in the next 2-3 weeks. The gold-silver ratio just made a new high above 87 and reversed quickly last week. From a technical perspective the high both on the daily, weekly and monthly indicators was not confirmed by momentum indicators. This is called bearish divergence and is an important sign of a market turning down.
I have often said that silver is the leading indicator for the precious metals. Thus silver will take the lead in the coming precious metals bull market. It could be that we saw the turn already last week. If not it should happen later in May.
I normally don’t go in to detailed technical analysis and it makes no difference as regards the long term very bullish fundamental position of the metals and the bearish outlook of stock markets.
So the metals are soon ready to start the most spectacular bull market that the world has ever seen. This market is like a coiled spring and we will see rapid moves to the upside in both gold and silver. The first target for gold, which could be reached quickly, is $1,600. Silver will probably go to at least $25 at the same time.
As I discuss at the beginning of the article, a higher gold and silver price is sadly associated with difficult conditions in the world, both economically and socially. But initially the move will happen before the difficult times start.
PROTECTION IN GOLD & SILVER – AT LEAST 25% OF FINANCIAL ASSETS
Wealth preservation investors must remember that the forecasts above are about short term timing and not about protecting your wealth. The risks in the world are now of a magnitude that any serious investors, who wants to avoid a total annihilation of his wealth, must reduce his exposure to all the bubble assets, stocks, bonds and property, as well as to the banking system.
Gold and silver have always been the ultimate insurance in any period of crisis. Since the coming collapse is likely to be greater than anything seen in history, the protection against the present risks in the system must also be greater. In these circumstances, I consider that 25% in physical gold and silver is an absolute minimum. I know it might sound dramatic to many people but what is going to happen to the world economy and financial markets will also be spectacularly dramatic. Therefore it is absolutely essential to hold adequate protection.
Original source: Matterhorn - GoldSwitzerland
Reproduction, in whole or in part, is authorized as long as it includes all the text hyperlinks and a link back to the original source.
The information contained in this article is for information purposes only and does not constitute investment advice or a recommendation to buy or sell.


