We are currently seeing a divergence between two fundamental commodities: oil is essential for economic growth, while gold is essential during a crisis. These two resources can therefore be considered as antinomic according to their main characteristic. This is why, although oil prices have fallen by two thirds following the coronavirus pandemic, gold prices have risen.
Gold price vs. oil price from September 1999 to June 2020
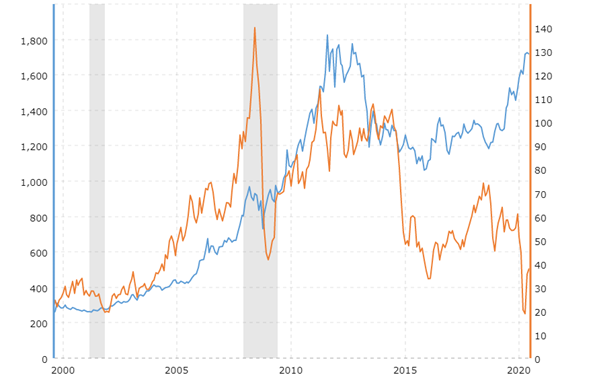
Gold is therefore not only a commodity, but also a monetary metal and a safe haven currency. It is therefore normal that in times of economic crisis, the yellow metal surpasses all industrial commodities. Nevertheless, the extent of the divergence remains striking.
There is no direct link between gold and oil prices, but there may be indirect consequences in the medium term, particularly due to the geopolitical repercussions of a plunge in the price of a barrel, as occurred in April 2020.
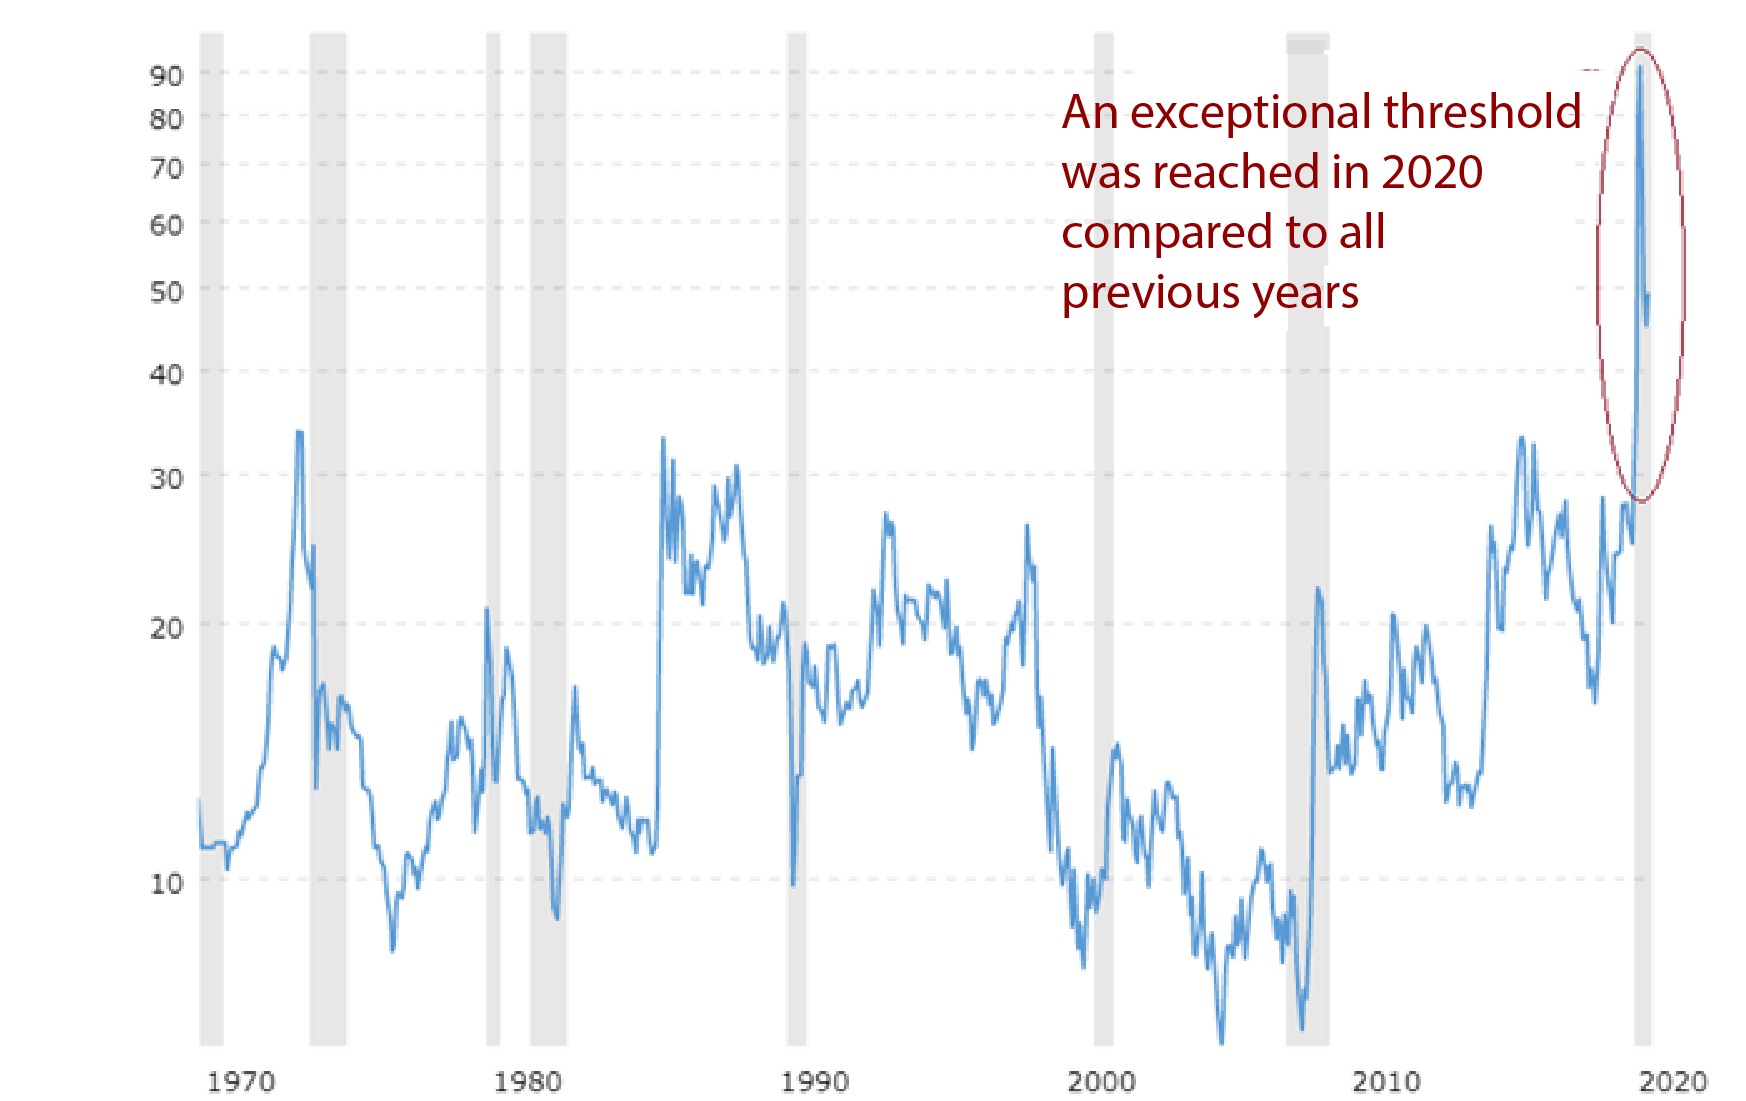
Let's take a look at the chart below, which shows the gold/oil ratio:
Gold/oil ratio from September 1999 to June 2020
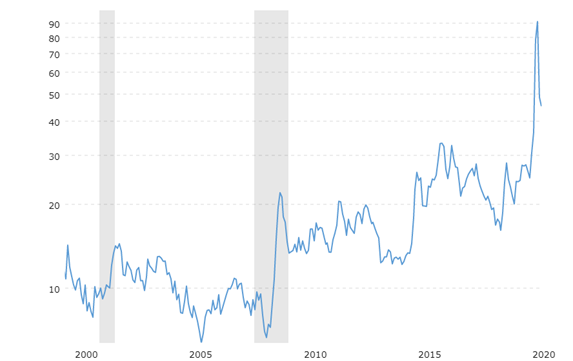
Source: macrotrends.net
As we can see, the ratio between these two spot prices climbed above 100 in March. The gold/oil ratio is therefore much higher than the historical average and we also observe similar trends in the ratio between gold and other precious metals. Gold may obviously decline in the short term, especially if we see a liquidation of gold ETC/ETF positions on the stock market, but the long-term trend is extremely favourable to gold. It is therefore highly likely that oil prices will eventually rise in the long term to reduce the gold/oil ratio, just as the gold/silver ratio narrowed last July from 114.77 on April 1, 2020 to 70.45 the following August.
Gold/silver ratio from March 2019 to August 2020
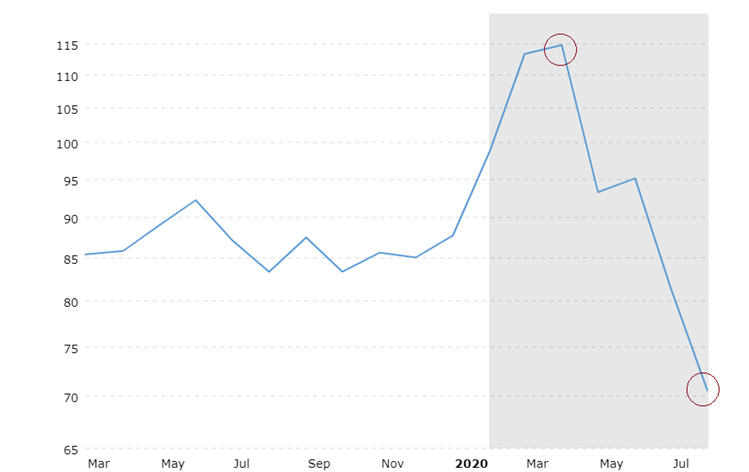
Source: macrotrends.net
Like gold, silver has largely outperformed the commodities market in the recent period. This is shown in the chart below, which tracks the returns of gold, silver, oil and copper, as well as the ASX 200 (the Australian Stock Exchange's stock market index) from the end of September 2018 to the end of February 2020:
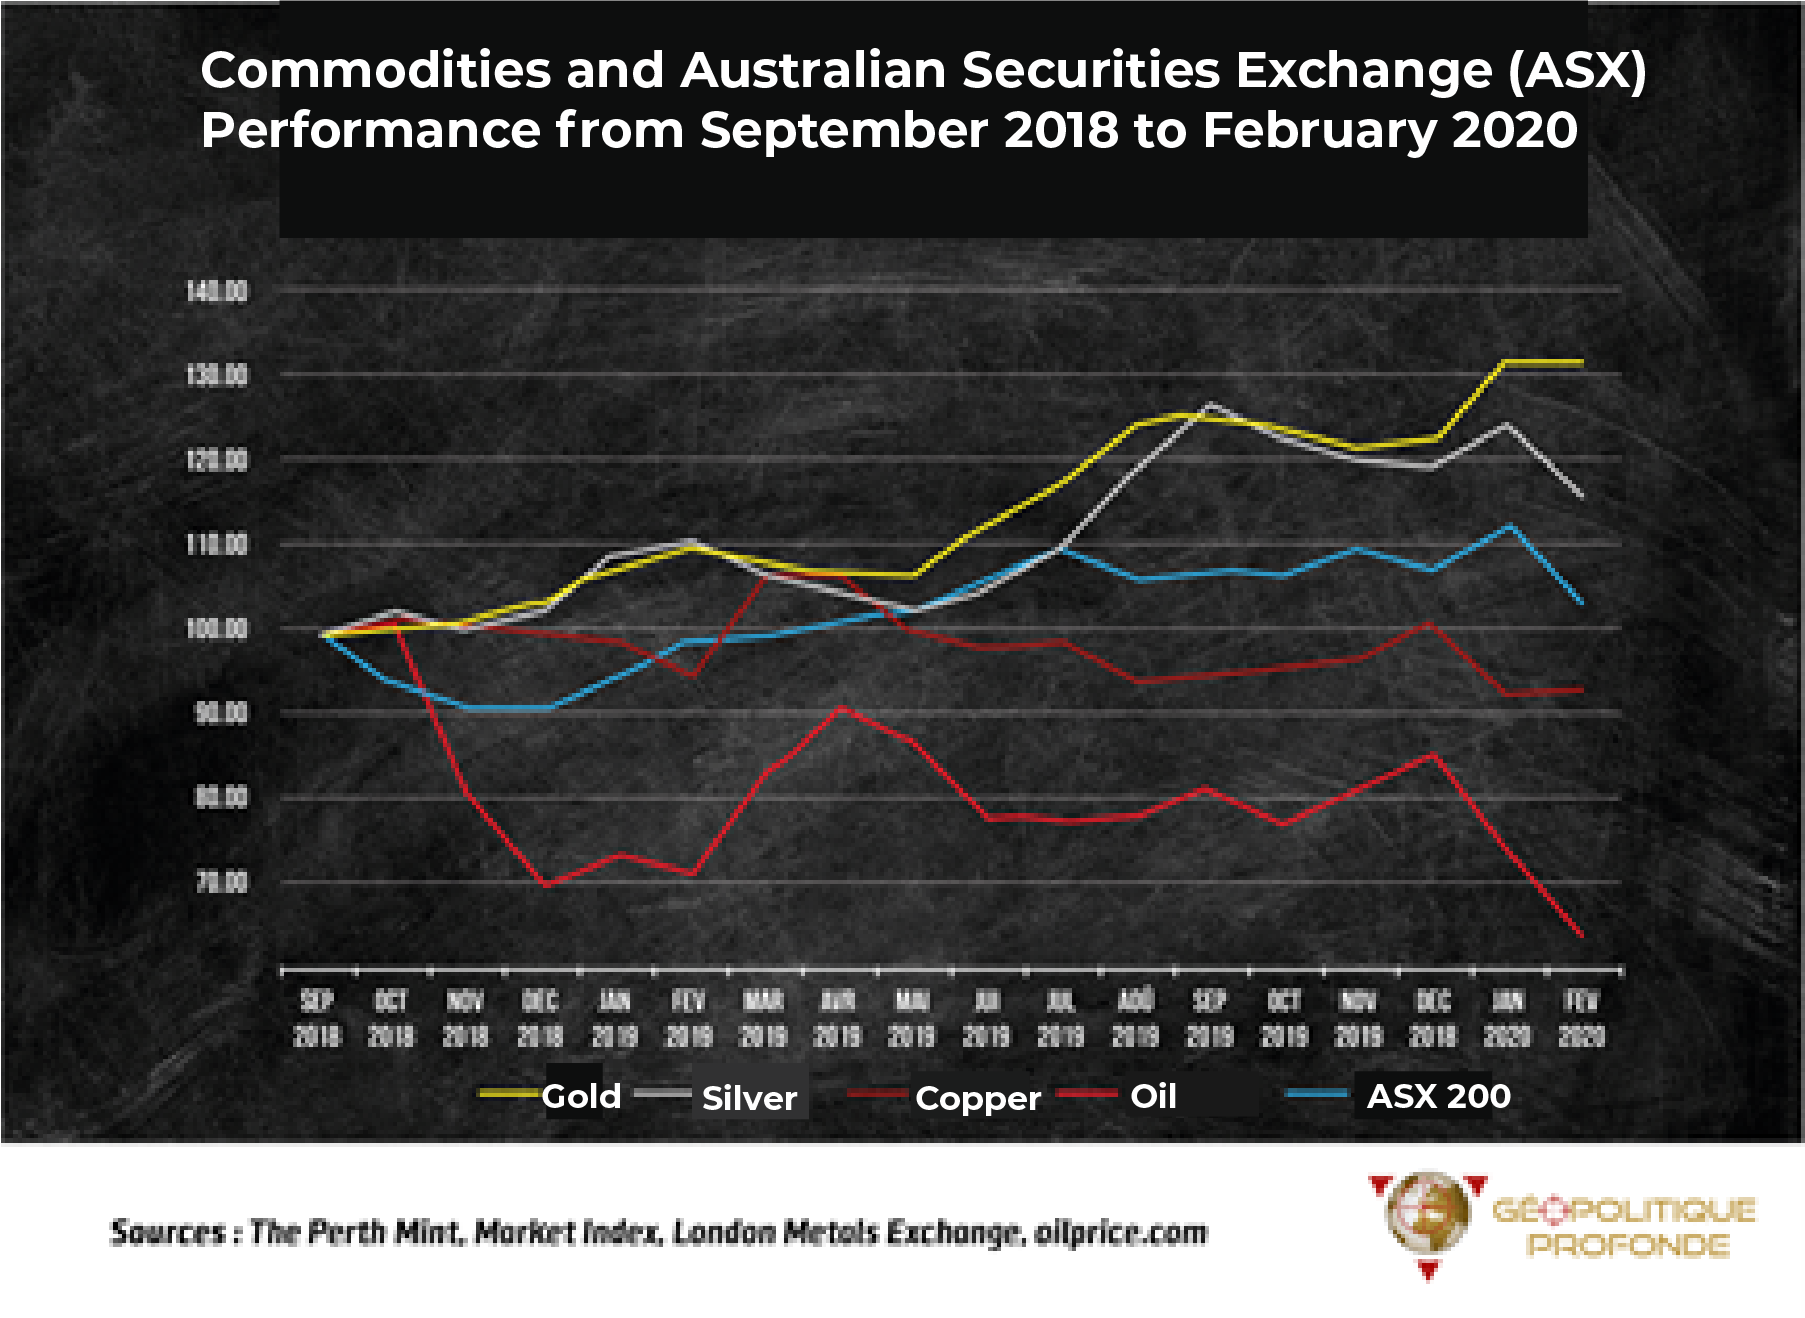
This chart shows that gold and silver both have monetary safe haven qualities that are greater than their industrial value. This is in contrast to most commodities that historically sell during periods of weak stock markets and/or increased concerns about the health of the global economy.
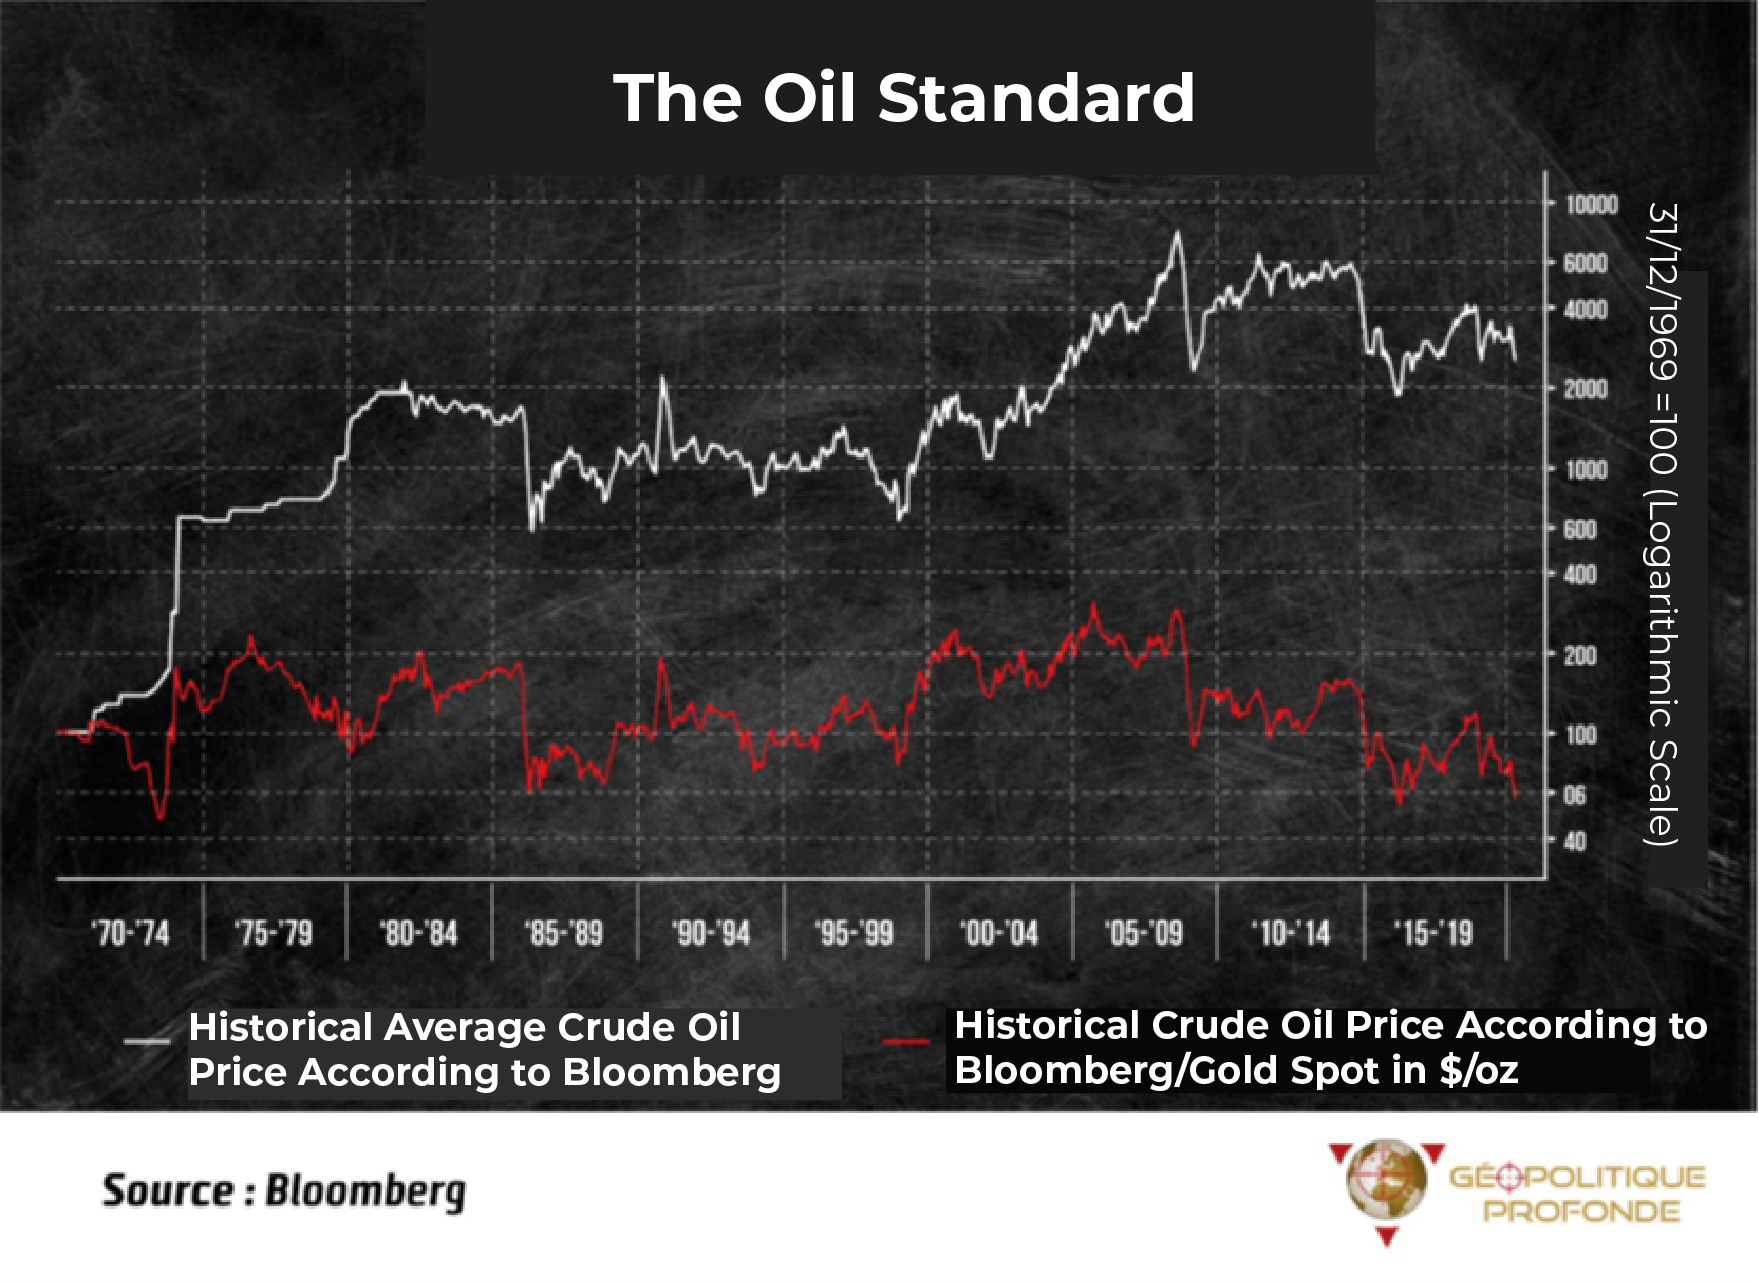
GOLD STANDARD VERSUS OIL STANDARD
The oil standard embodied by the petrodollar replaced the gold standard and the Bretton Woods system after the suspension of the dollar's convertibility into gold by US President Richard Nixon in 1971. In other words, since that date, oil has become the international monetary reference instead of gold. At the time, producers tried to defend themselves against the decline in the purchasing power of the dollar by increasing the price per barrel to keep it constant in terms of gold.
The gold/oil ratio measures the amount of gold you will have to pay to buy a certain amount of oil. As the chart shows (orange curve), it ended the 1970s almost exactly where it started, despite the massive rise in the dollar.
TO CONCLUDE
- Optimistic scenario (least likely): In the event of a sustained recovery, the barrel could rise in tandem with gold prices, but at a different pace in the short to medium term.
-
Pessimistic scenario (most likely): In the event of a severe crisis, the barrel could stagnate or even fall in the short-medium term, unlike gold, only to rise in the medium-long term to restrict the gold/oil ratio to an intermediate level. In fact, a gold/oil ratio that would only increase given gold's upward trend would be untenable; historical chart fundamentals tell us that if gold rises, oil should follow at some point.
Gold/oil ratio since the 1970s (end of the gold standard)
Both gold and oil assets are undeniably attractive long-term investments according to the analysis of their ratio.
Reproduction, in whole or in part, is authorized as long as it includes all the text hyperlinks and a link back to the original source.
The information contained in this article is for information purposes only and does not constitute investment advice or a recommendation to buy or sell.


