Since the creation of the Federal Reserve in 1913, the stock market has outperformed Gold and Silver significantly. Here is a great chart (from longtermtrends.net) that proves this:
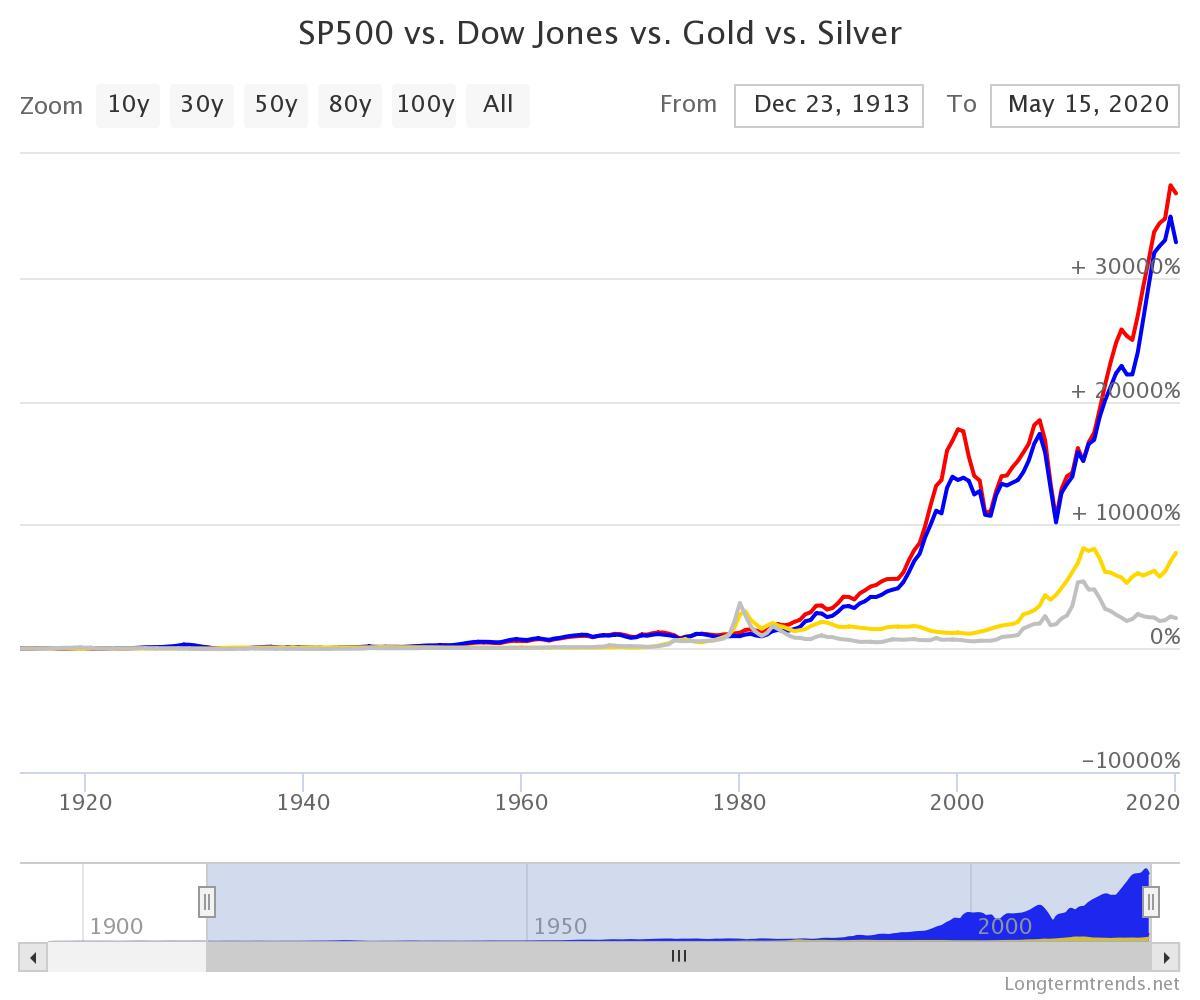
The S&P 500 is in red, the Dow in blue and Gold and Silver in their native colours. The outperformance is huge. Through the debt-based monetary system, the Fed facilitates the extension of credit which disproportionately benefits assets like general stocks and bonds.
During each credit cycle, Silver and Gold prices mostly loses relative value to assets like general stocks and commodities. In other words, inflating the currency supply (inflation) does not benefit Gold and Silver relative to most other significant assets like stocks (the chart above is really the proof of this).
It is only after a certain point in that inflating credit cycle that Gold and Silver are able to catch up. That is normally after significant stock market peaks. This was the case after the 1929 Dow peak, the 1966 and the 2007 Dow peak.
Those stock market declines (from all-time highs) are often the trigger for the deflation of debt (which is the other side of the “balance sheet” for the those inflated assets that are now declining).
Debt is virtually the opposite of Gold and Silver. When debt is deflated, it provides the fuel for Gold and Silver to rise significantly in order to catch up. It is really the balancing of a mathematical formula; the balancing of debt-based monetary system abuse. We are still early in this “catch up”, and Silver and Gold is really still at a bottom when it comes to debt.
How can we know this? Just look at debt levels; it is at or near all-time highs. When debt (bonds) is priced high, then Silver and Gold is low. Or put another way, when interest rates are low (that means debts or bonds are high) then Gold and Silver is low.
In terms of interest rates (or debt) Silver and Gold are at real lows. Here is a Silver chart that proves this:
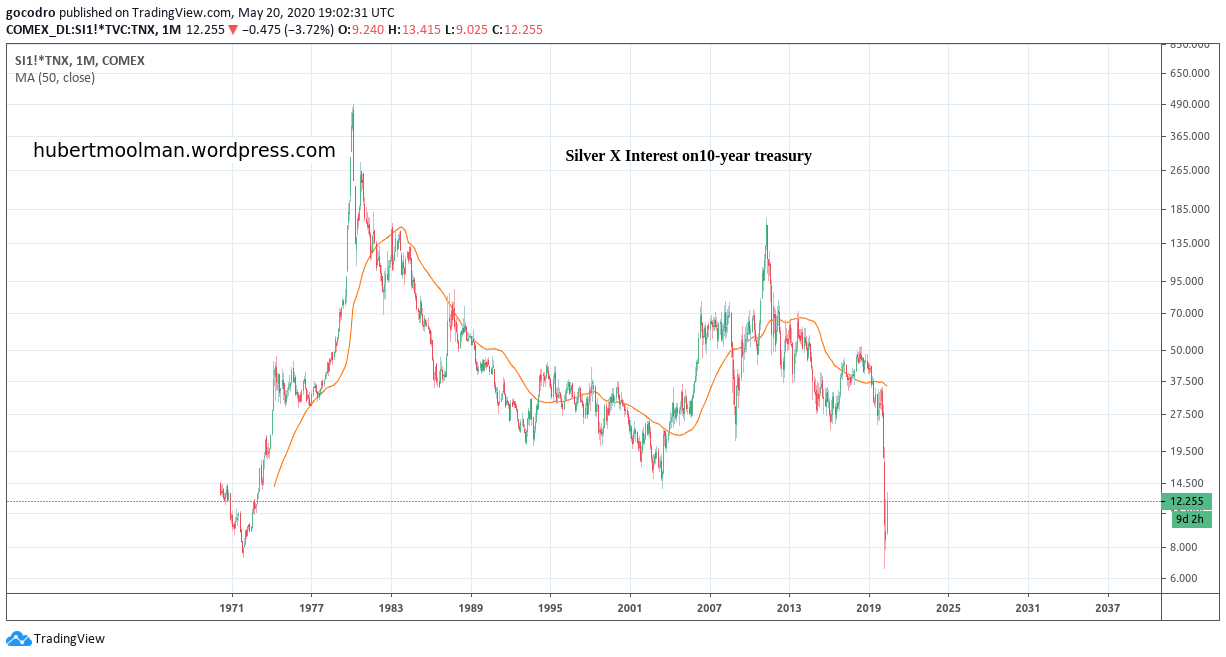
It features the Silver price multiplied by the interest rate on the 10-year US Treasury. It has just recently hit a new low, even lower than the 1971 low. It is still a long way before Silver is at relatively high prices, and debts at lows (or interest rates at highs), which means this chart will then likely be at all-time highs.
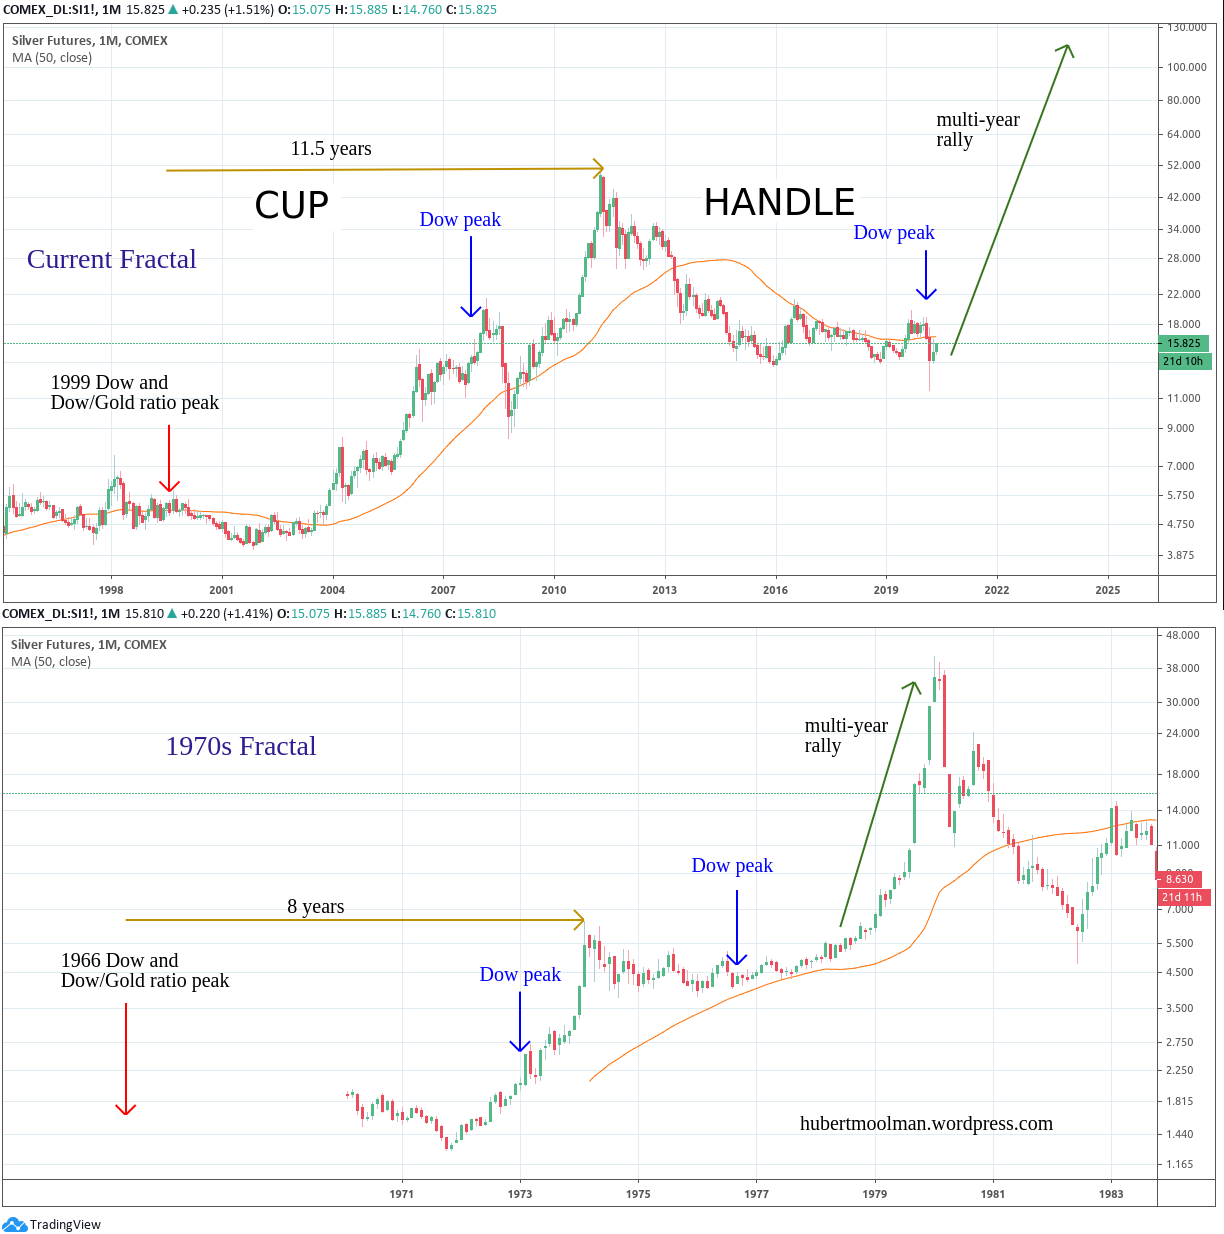
If the February 2020 Dow top is the peak, then we are likely in another catch up phase. Catching up to more than a 100-years of credit abuse that has kept Silver and Gold prices artificially low.
For Silver, it makes the completion of these patterns imminent:
Original source: https://hubertmoolman.wordpress.com
Reproduction, in whole or in part, is authorized as long as it includes all the text hyperlinks and a link back to the original source.
The information contained in this article is for information purposes only and does not constitute investment advice or a recommendation to buy or sell.


