In May 2017, I started commenting for my followers the extraordinary journey of the Caracas stock market.
In 2013, the Venezuelan Stock Exchange index hovered around 100. But successive devaluations of the bolivar quickly brought the stock market around 1 000.
On January 2, 2015, the Caracas index listed 3 936. A year later, to the day, it was at 14 588. It touched 100 000 in June 2017 and then 551 875 on October 6.
Great performance, you would tell me! But you haven't seen anything yet.
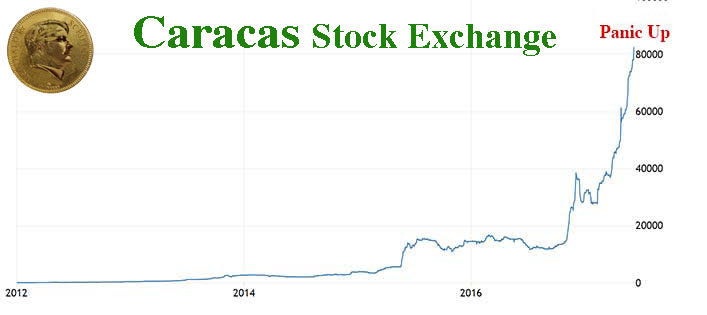
I have a chart from December 5, 2017, where the index is at 1 409 000 and another one in February 2018 where it is at 4 million.
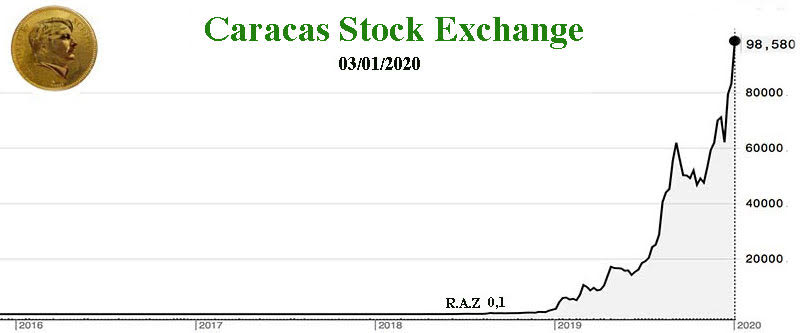
Venezuelan authorities ended up dividing the index by 10 million at the end of 2018. It restarted trading at 0.1.
This January 3, 2020, the index was again at 98 580... So close to 1 000 billion bolivars on the old scale.
Awesome, right?
If I’m talking about Caracas, it’s to draw a parallel with Wall Street.
In Venezuela, the stock market goes up because the currency devalues... The same is true in New York.
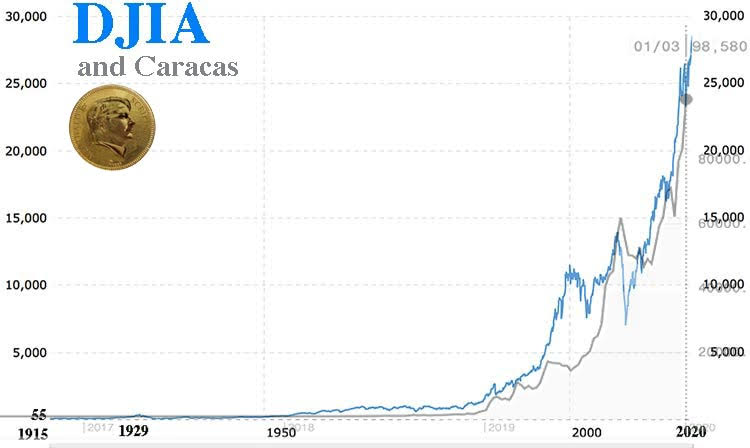
The New York Stock Exchange has been going up faster and higher and higher since the start of the key rate cut in the 1980s...
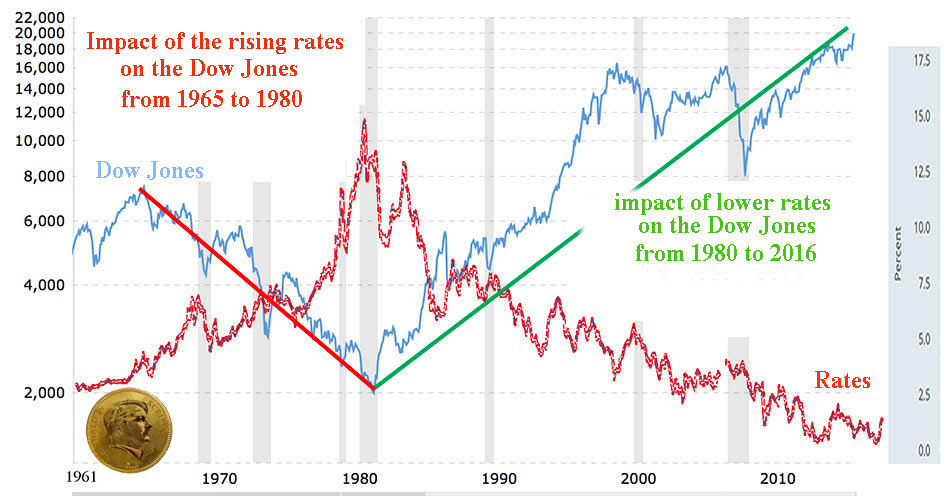
And the rise has become geometric with the massive monetary injections from the various central banks.
In reality, the more money is created, the more money devalues.
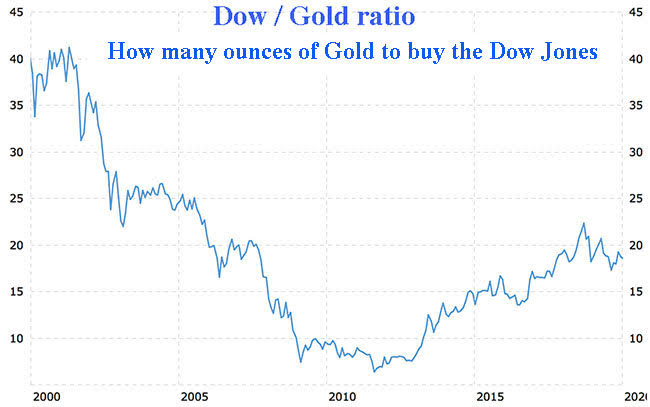
If you take the Dow Jones value expressed in ounces of gold, the stock market has halved since 2000.
The rise in the stock market on Wall Street is therefore an optical illusion, like that of Caracas.
The yellow metal is set to rise sharply in the coming months.
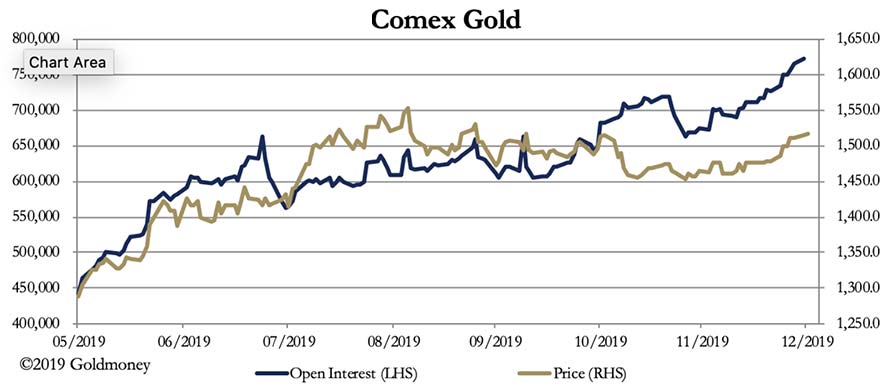
Open Interest at Comex has set new historical records day after day. The highest was marked on January 6 with 797 110 contracts of 100 ounces of gold.
As it can be seen in the chart below, the price of gold follows the number of contracts on the comex. Prices will soar.
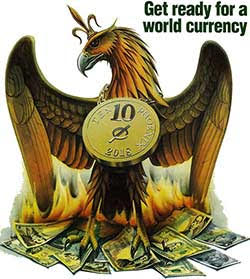
In 1988, The Economist, the Rothschild's magazine, had announced a world currency reform to come "around 2018". The gold coin, around the neck of the Phoenix reborning from the ashes of fiat money, already showed that gold would have a role to play in backing the currency.
The message was repeated in March 2009 by China calling for monetary reform. She asked for a basket of currencies like the SDR, guaranteed by tangible values, with explicit reference to the Bancor de Keynes.
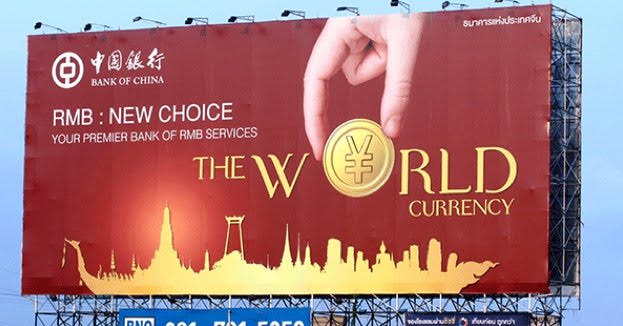
Since then, China has bought all the gold and physical silver it could. At the same time, his posters announced the color in Asia.
Since November 30, 2015 and even more since September 2018, the rise in the price of gold has been initiated on the Shanghai Gold Exchange.
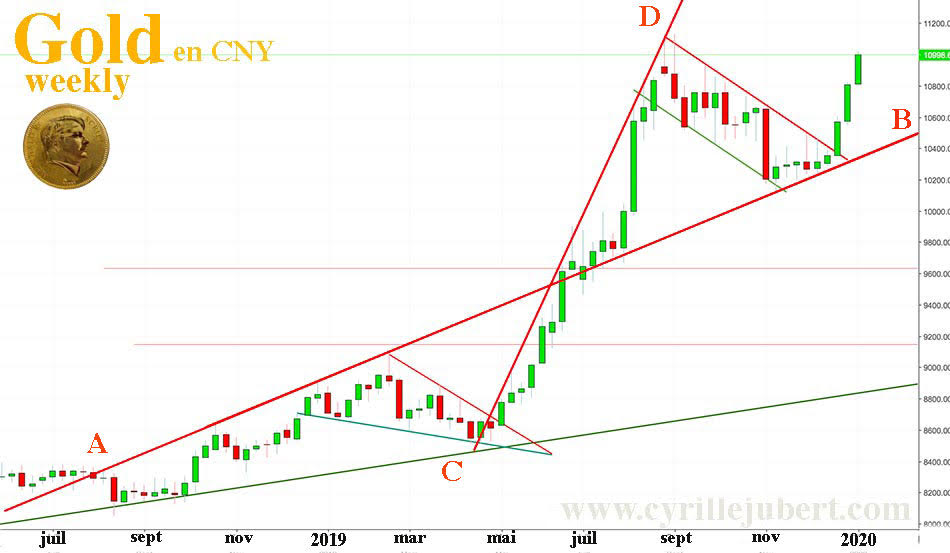
On the chart underneath, we can see that the AB resistance was broken in mid-June and has since become the support.
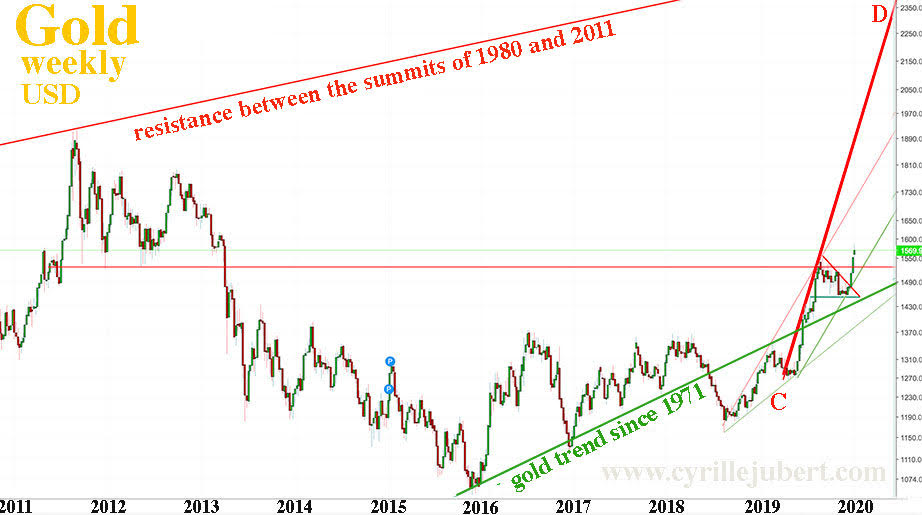
The new resistance is marked CD on this chart. It is much more vertical. So there will be a further acceleration in the rise of gold.
If we report this on the gold dollar chart, the 2011 peak could even be reached before the end of February.
The inevitable monetary collapse
From the end of 2017, the Fed had plans to raise rates and reduce its balance sheet. This spawned a series of crashes and the Fed had to give up and even cut rates.
Today, central banks have two options:
A) or they continue to inject liquidities to support the markets and save the banks, until a total collapse of the value of the currency, Caracas style.
B) or they stop this policy of monetary expansion and this causes a very short-term financial crash and very deep deflation.
For the moment, the scenario A is being played. The stock market going up suits politicians, and notably Trump, who is playing for his re-election in November. Politicians in Europe want to avoid the collapse of banks and the plunder of savers. The "yellow vests" are aware that their purchasing power is declining, but do not understand that it is a political choice at the highest level and that it will worsen in the months to come.
What seems to be taking shape for gold should logically be the same for silver.
If we compare the bullish rally of 2016 to the current rise, we note first, that the peaks of the first two legs of rise were made significantly higher in 2019 than in 2016.
As you can see, in the third rising leg of 2016, the fourth weekly candle attacked the $ 18 resistance but closed below. In 2020, the close was over.
In 2016, the fifth candle, once the resistance had been passed had been extraordinarily bullish and the sixth did hit the $ 21 target of Fibonacci.
In January 2020, the resistance of $ 18 had been passed, silver should make a strong push higher in January-February towards $ 21 and beyond...
The Comex Silver Open Interest is very close to setting a new historic record.

If the gold analysis holds true in the coming weeks, silver will follow, bringing a violent short squeeze expected in the last half of February.
"In politics, events never happen by chance," wrote Roosevelt.
Current geopolitics in the Middle East serves the interests of central banks by raising the price of a barrel, thus avoiding a deflationary crisis. It goes in the direction wanted by the highest monetary authorities, who can thus justify the rise in gold by the fear of the outbreak of a world war, whereas this rise is essential to the Monetary Reform envisaged and programmed for a long time.
This article is not an encouragement to play on the markets and even less with leveraged instruments. Secure your cash and capital in physical gold and silver kept outside the banks.
Reproduction, in whole or in part, is authorized as long as it includes all the text hyperlinks and a link back to the original source.
The information contained in this article is for information purposes only and does not constitute investment advice or a recommendation to buy or sell.


