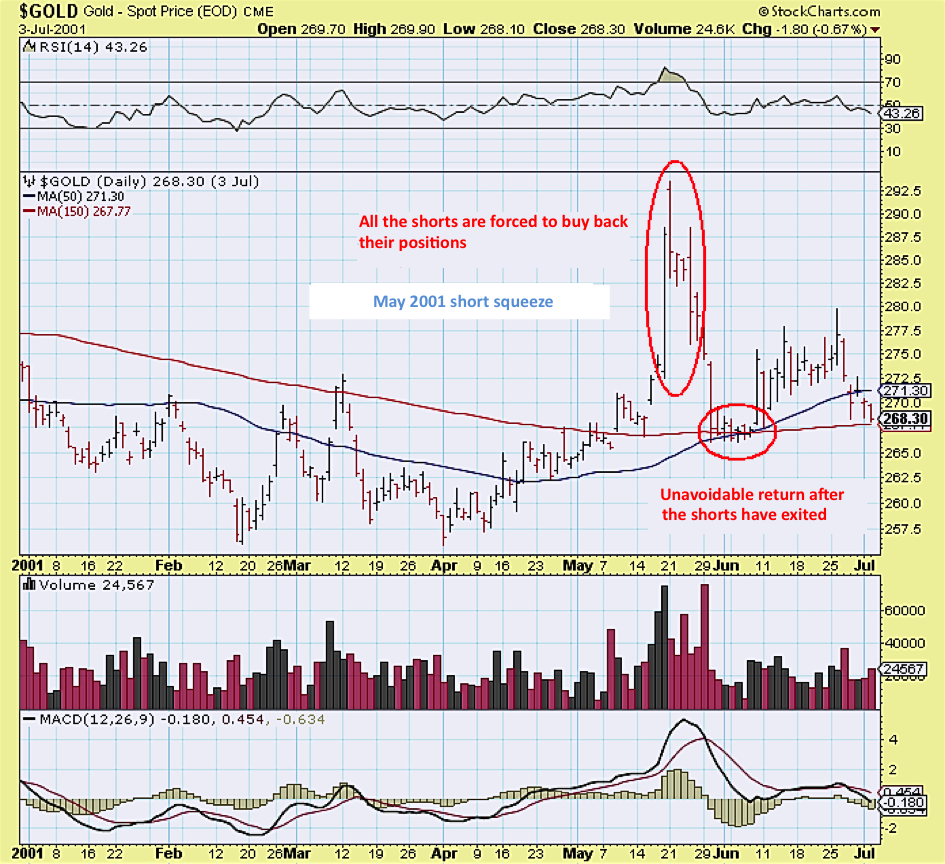
Since February, the gold market has been in short-squeeze mode. This is a process by which excessive speculation on the declining gold price is being eliminated. The more the price goes up, the more of those speculators are forced to buy back their short positions. When a speculator closes his short position he has to buy it back, hence participating unwillingly to the upward bullish spiral. This is a short squeeze, a laundering of short participants, after a long period in which shorting gold was profitable. And there were lots of shorts! Furthermore, many bullish investors were waiting on the sidelines for an ultimate possibility of buying under 1000 $. But as they saw gold going up vertically, this triggered buying on their part, which helped fuel the rally. We can see it clearly in the uptick of gold ETFs.
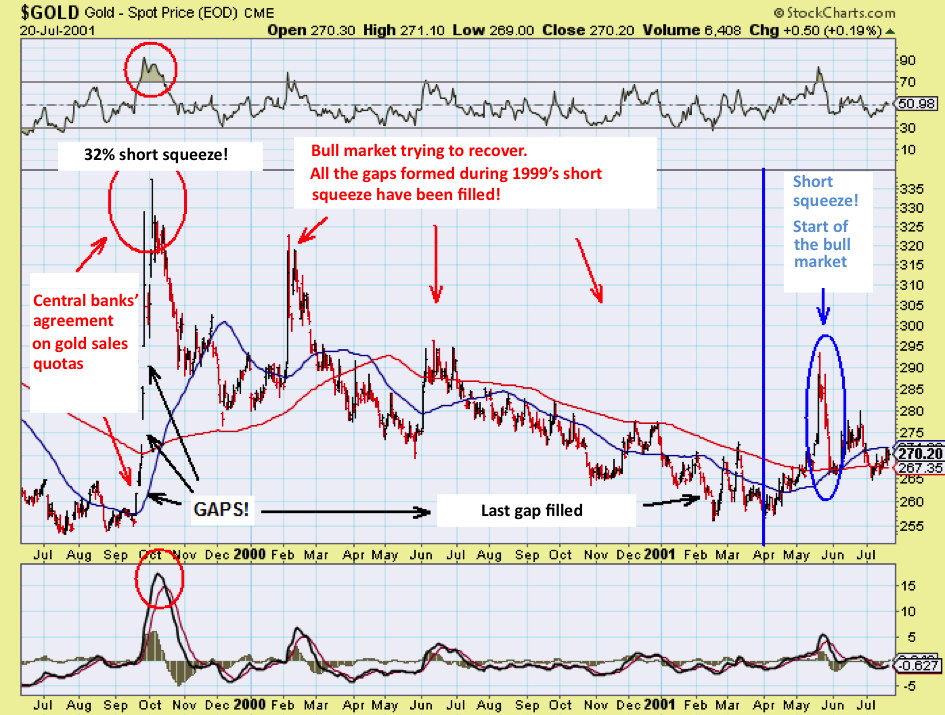
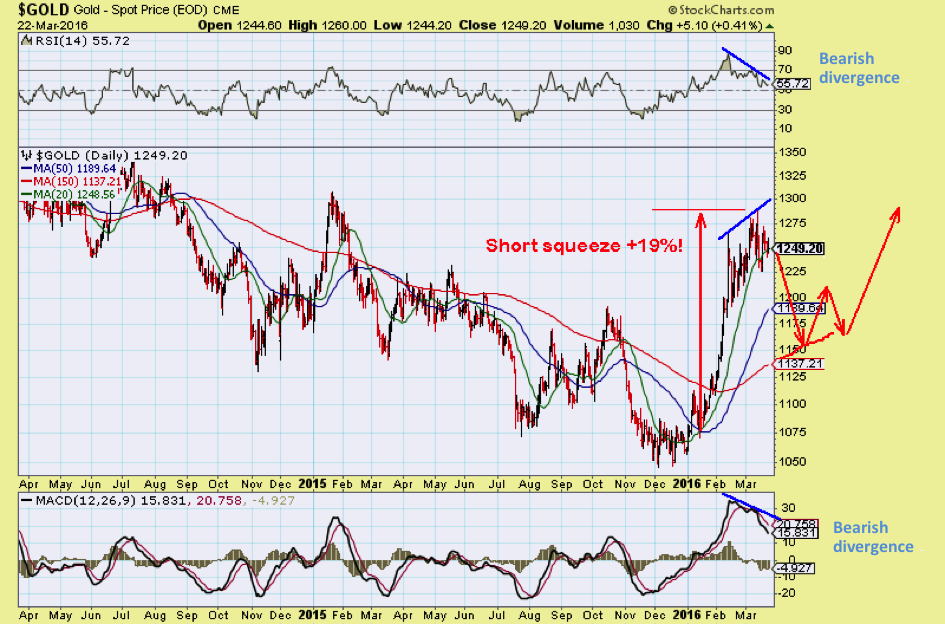
A first bullish move in a new bull market often produces a short squeeze. We saw one in 2001 that caused a 12% rally from the last time it touched its 50-day moving average. And today, we’re already at 19%!
This kind of phenomenon goes to show how much technical analysis is lacking in trying to pinpoint an intermediate peak in a bull market, as well as how much fundamental analysis is lacking in determining the final trough of the bull market. In 2014 and 2015 we heard enough positive news for the gold market that should have taken it out of its lethargy, but it waited until the start of 2016 before analysts were unanimously pessimistic, which caused the highest quarter increase in 30 years. Most surprising was that it took off like a rocket, bringing the gold/oil ratio to an historic record! Even during the Great Depression, when demand for oil fell dramatically, the gold/oil ratio had never exceeded 40. In the course of this extraordinary rally, it touched 46, or almost three times its mean historical value. And this happened without a stock market crash, without an economic collapse other than this slump that started with the 2008 crisis, without a third World War, without notable inflation. The only bullish factor I see is the generalisation of negative interest rates and, probably, a nascent loss of confidence in the central banks. On the other hand, there was a terribly negative factor in place at the start of the year: the collapse in the price of all commodities. So I’m having a hard time finding any other explanation than a short squeeze for this sudden surge in the gold price: the price was too low for the physical gold market and the short speculators were too many, making the price artificial. The elastic band just snapped in their faces! But beware, because once the elastic band ends its backfire movement, the price could once again retract for a little while...
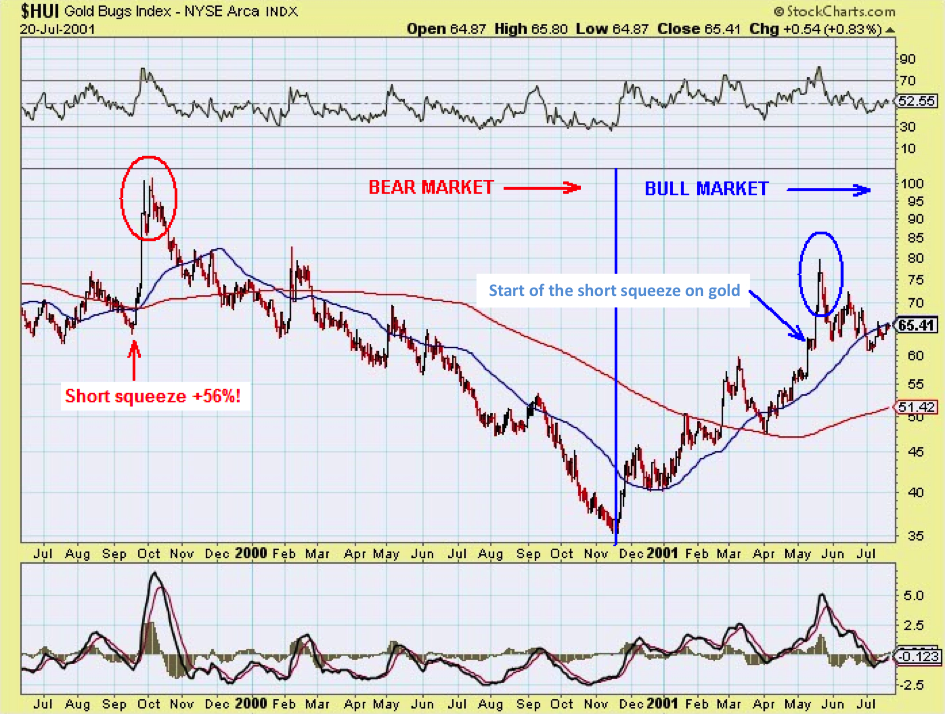
The last chart shows the corresponding reaction of the gold miners with the HUI index. Contrary to today, the HUI had largely anticipated the end of the gold bull market six months in advance.
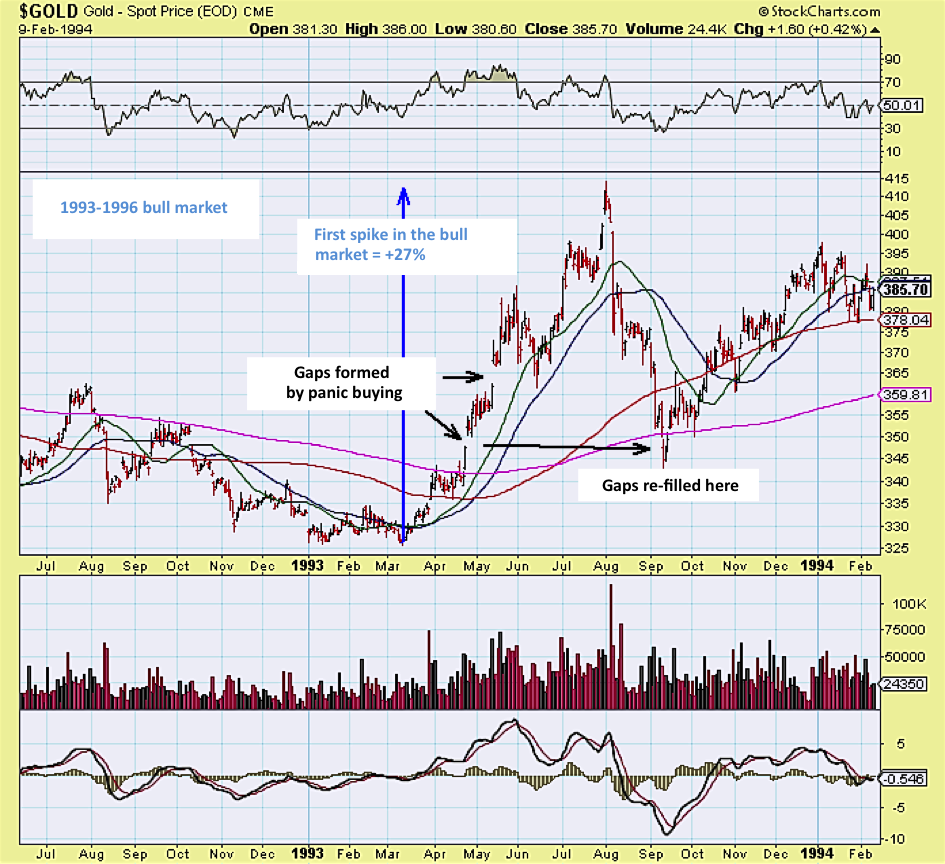
Now, let’s go back further in time and observe gold’s reaction at the start of its intermediate bull market of 1993.
We can see that in 2001, the miners had started their bull market before gold, contrary to what’s happened this year, which took everyone by surprise!
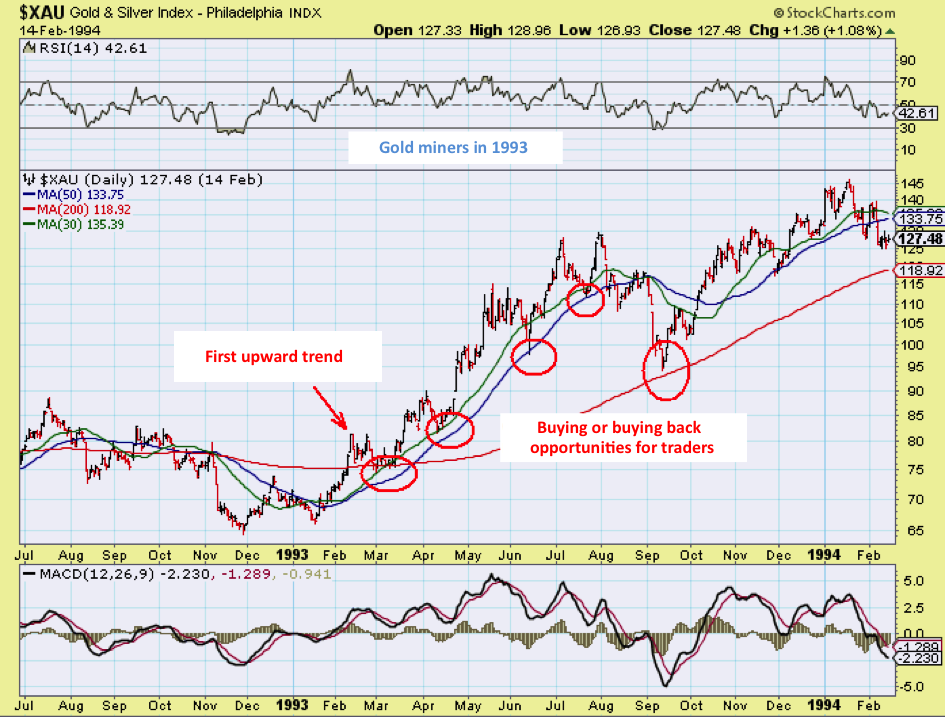
For gold in 1993, still, there was a test of the 325-day moving average, five months after the start of the rise. That test allowed some late comers to get in at very good prices, but most of those late comers pulled their hair out for three months, until there was, at last, a correction. And when such a correction happens, those have a tendency to get in too early and said correction brings them much lower than what they thought. This is quite typical, and this is why I only recommend buying at the 150-day moving average during a bull market.
In 1993, the gold miners in the XAU index rose nearly 100% in six months before correcting at the 200-day moving average. Today, the XAU index is showing a nearly 90% increase in the span of two months!
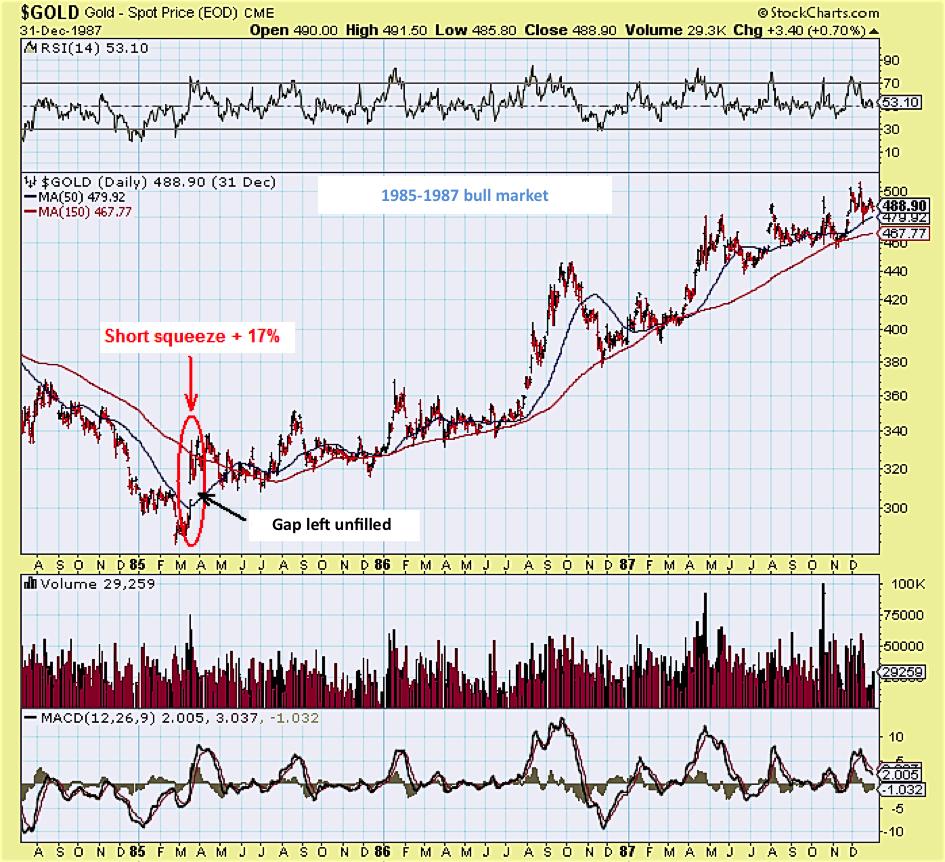
During the 1985-7 bull market, we’ve also seen a 17% short squeeze followed by a correction on the moving averages that retraced half of the rise. During this very regular bull market, it would have been possible to accumulate regularly at the 150-day moving average, the long moving average best suited for the gold market.
If we take a look at the present short squeeze, we see that the 150-day moving average is still at $1,137, and that the risk of falling back down to it is real. A continuation of the peak to $1,400 is possible, but the second peak, slightly above $1,280, has not been confirmed by the RSI and MACD indicators, thus creating an ominous bearish divergence. And the more the rise goes vertical, the more the following correction will hurt the late comers. It would be much better for the sake of this new bull market (which will only be confirmed by establishing a higher trough than the last one) if there were a serious correction to this rally before going any further.
This rise to $1,280 wasn’t what I had figured at first, and this kind of reaction must make us humbler in our chart forecasts.
On the other hand, there is a lot of inertia in the markets, and they can remain oblivious to reality for a long time. I remember that in the early 2000’s, gold already had all the reasons to rise to $2,000, when it was worth only $300. Each time there was a vertical spike, over-excited analysts, though well versed in gold’s fundamentals, thought it was “the big one”, the spike that was to bring the collapse of the financial system.
I have witnessed enough temporary gold spikes to know that patience is better rewarded than rushing in to buy when there is a vertical spike, however convincing, unless, of course, we find ourselves in the final “maniac phase” of the gold bull market. But for now, we’re just exiting a long intermediate bear market, and what is most probable is a gradual setting of the bull market, with a moderate rise to start with, followed by a steeper rise as the bull market takes hold.
The rise in the gold price since the start of the year is not sustainable, as far as I’m concerned, and we will need to see a correction in order to gather new strength, while returning to a trough slightly above the one established in 2015 (generally, the 150-day moving average makes for a reliable support point), thus defining a less abrupt upward move and, above all, purge the excess of bullish sentiment on the short term on the gold market.
Reproduction, in whole or in part, is authorized as long as it includes all the text hyperlinks and a link back to the original source.
The information contained in this article is for information purposes only and does not constitute investment advice or a recommendation to buy or sell.


