The most important piece of evidence that the next great bull market in gold has begun is the technical behavior of the prior bear market itself.
Over many decades, commodities rallies have exhibited 50% retracements (bear markets) before resuming their long-term upward trends based on the slow, steady devaluation of the fiat currency in which the commodities are priced.
Using the $252 price from August 1999 as a baseline and referencing the September 2011 peak price of $1,900 per ounce, gold gained $1,648 per ounce in the bull market. A 50% retracement of that 12-year rally means a decline of $824 per ounce (i.e., 50% of the $1,648-per-ounce gain), which would put gold at $1,076 per ounce.
Guess where gold bottomed?
It bottomed at $1,051 per ounce, within 2% of the 50% retracement target. That decline is an almost perfect technical retracement.
By itself, this pattern proves nothing without additional confirmatory evidence. This is why we did not call the end of the bear market in 2015. We needed more proof.
There were (and still are) plenty of analysts calling for $800-per-ounce gold. How do we know that recent gains are not just another bear trap?
The reason rests in the consistency of the gains. Gold rose 8.5% in 2016, a solid if not spectacular gain. Then gold rose again in 2017, by over 12%.
Gold fell on an annual basis in 2013, 2014 and 2015. Gold has not had back-to-back annual gains since 2011–12. These back-to-back gains in 2016–17 point to a solid foundation and a decisive break in the prior years’ bear market trend.
This “steady Eddie” performance the past two years has been overshadowed by much more spectacular gains in stocks and bitcoin.
Recent gains in stocks may continue for a while but are ultimately unsustainable because of the likelihood of a recession or liquidity crisis in the next few years. In those conditions, a retreat in stock prices of 30–50% would not be at all unusual.
Bitcoin is an unprecedented combination of fraud, mania and a Ponzi scheme all in one. The bitcoin price could go higher in the short run but will also end in tears, with 90% losses for naïve “investors” from around the world lured into an artificially pumped-up mania.
Meanwhile, gold is in the early stages of a sustainable long-term bull market that will come to surpass the 1999–2011 bull market in time.
Investor psychology has been slow to change despite recent gains. Gold investors have been discouraged by the periodic drawdowns in the gold price, including the November–December 2016 mini-crash after Trump’s election.
But these short-term drawdowns need to be considered in the context of the much more positive long-term trend just described.
The historic 1999–2011 rally also started slowly and then gained steam. The largest percentage gains year over year did not begin until 2005, almost six years after the bull market began. From there the bull market still had almost six years to run.
In addition to the retracement pattern and back-to-back annual gains that validate the start of a new bull market in gold, another technical pattern (with fundamental roots) has emerged as a positive for gold.
I’m sure you’ve heard the old adage that things happen in threes. This can apply to good things and bad. Right now we’re witnessing a positive phenomenon in threes when it comes to gold and Fed monetary policy.
On Dec. 16, 2015, the Fed raised interest rates for the first time in nine years. This was the famous “liftoff” and happened after the Fed teased markets about a rate hike through all of 2015.
Immediately after the rate hike, gold surged from $1,062 per ounce to $1,366 per ounce by July 8, 2016, a spectacular 29% rally and gold’s best six-month performance in decades.
Then on Dec. 14, 2016, the Fed again raised rates for the first time since the December 2015 rate hike despite earlier expectations that the Fed would hike rates four times in 2016. Gold surged again from $1,128 per ounce at the time of the rate hike to $1,346 per ounce on Sept. 8, 2017, a 19% rally in just over nine months.
Last month, for the third December in a row, the Fed hiked rates again after taking a “pause” on rate hikes in September. Once again, gold answered the starting gun. Gold immediately rallied from $1,240 per ounce on the afternoon of Dec. 13 to $1,258 per ounce the next day, a solid 1.5% gain in one day.
If gold follows the pattern of the last two December rate hikes, this new rally could go to $1,475 or higher by next summer. That would be a 20% rally in six months, roughly comparable to the rallies after the December 2015 and December 2016 rate hikes.
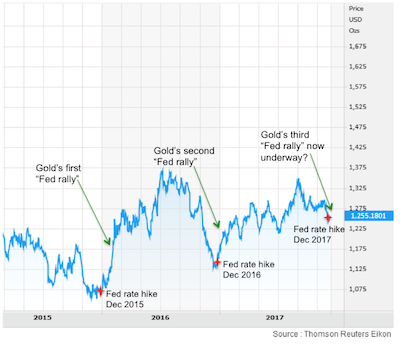
This chart shows the U.S. dollar price of gold from March 2015 to December 2017. The Federal Reserve (“Fed”) raised interest rates in December 2015, December 2016, and December 2017. After the first two rate hikes, gold staged spectacular rallies of 29% and 19% respectively in a matter of months. Gold is up about 4% since the Fed’s December rate hike. A powerful new “Fed rally” has begun from a higher level than the past two. This should take gold to $1400 per ounce by mid-2018.
Of course, nothing moves in a straight line. There will be new drawdowns to go along with the new rallies. But the upward trend seems well-established at this point.
Some of this price action following the three December rate hikes could just be noise or coincidence. We all learned in statistics class that correlation does not mean causation. And three events may correspond to the adage, but it’s not exactly a longtime series on which to build a statistical case. Still, it’s an intriguing pattern.
Gold has a reputation for being the most forward-looking of all macro indicators. Gold investors smell trouble and opportunity long before stock and bond markets catch the scent.
The fact that gold would rally after a rate hike is counterintuitive. Usually higher nominal rates equal higher real rates, which is poison for gold.
Why the rallies?
The gold market is looking through the rate hike and asking what comes next. After all, the December rates hikes in 2015, 2016 and 2017 were all advertised well in advance by the Fed and were fully discounted by the market. This means that the rate hike was a nonevent, because gold was already priced for it.
Yet the rate hike itself and the Fed’s commentary suggest both a head wind for economic growth and possible Fed ease in the form of future inaction and forward guidance relative to expectations.
That’s exactly what happened after the 2015 and 2016 rate hikes. If the Fed takes its time on future rate hikes because of weak growth and disinflation, the dollar will weaken and gold will get a huge lift.
If the pattern of the last two years repeats this year, gold will reach a much higher level because it’s starting from a much higher level. The December 2015 rally started from $1,062 per ounce.
The December 2016 rally started from $1,128 per ounce. This rally starts from $1,240 per ounce.
This pattern of “higher highs and higher lows” has persisted through the past three years despite rallies and drawdowns along the way.
If good things come in threes, then this was the third December rally in a row and could take gold back to the long-awaited $1,400-per-ounce level. Now looks like a good time to jump on board to enjoy the ride.
What other evidence exists for the conclusion that we’re in a sustainable long-term bull market for gold and not just another false start?
The most important fundamental factor in favor of higher gold prices right now is the imbalance between physical supply and demand. I have seen both sides of this equation firsthand.
On the supply side, I have visited gold mines in South Africa, Canada, Australia and the U.S. I have been to gold refineries in Switzerland and gold vaults in Sydney, Switzerland and New Castle, Delaware. I speak with gold dealers on an almost daily basis.
On the demand side, I have met with government officials in Russia and China and with the senior officers responsible for gold trading at the biggest banks in China.
In every visit and every conversation, I encountered the same complaint: Physical gold is in short supply. Refiners can’t get enough to meet demand. Miners are looking at five-year lead times on new discoveries and reopening old mines shut in during the price collapse of 2013–15.
Vault operators are seeing the shift from bank storage to private storage, which reduces the floating supply needed to support the paper gold manipulations.
In addition, we are looking at several major gold spike catalysts in 2018, including a trade war with China and a shooting war with North Korea.
Russia, China, Iran and Turkey, what I call the “Axis of Gold,” continue to buy gold overtly and covertly in prodigious quantities.
The western gold powers such as France, Italy, Switzerland, Germany and the IMF have not sold an ounce of gold since 2010. The U.S. has barely sold an ounce of gold since 1980.
On a worldwide basis, demand is up and supply is down, and that can only mean one thing in the long run — higher prices.
This combination of fundamental, technical and geopolitical factors is converging in 2018 in a way we have not seen since the late 1970s. The new bull market in gold will be even more powerful than the 1971–1980 bull market and the 1999–2011 bull market.
Original source: Daily Reckoning
Reproduction, in whole or in part, is authorized as long as it includes all the text hyperlinks and a link back to the original source.
The information contained in this article is for information purposes only and does not constitute investment advice or a recommendation to buy or sell.


