Since the 1960s, the United States has run increasing budget deficits. From 2002 onwards, the annual deficits had been colossal. The US Treasury therefore generates debt, financed by Treasury bonds.
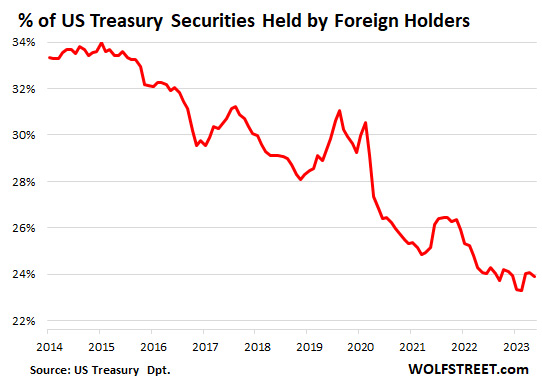
These bonds used to be purchased by all the world's central banks, which were obliged to hold dollars at least to pay for their oil and gas imports, which until very recently were only sold in USD. This is no longer the case. Russia, China, Japan, Brazil and Saudi Arabia sold all or part of their US Treasury bonds to dedollarize their economies. There has been a strong downward trend in the percentage of US bonds held overseas starting in 2020, when Federal Reserve's rates began to rise.
But a significant proportion of these Treasury bonds are purchased by American banks, pension funds, US government agencies, because for more than 70 years, these US T-Bonds have been classified Tier-One, therefore the safest investment which that is, the best guarantee of capital.
Except that, when key rates rise, those who hold old Treasury bonds with a lower yield will seek to sell them to buy the latest bonds issued by the Treasury, which offer a better interest. As a result, on the market, the value of the bonds falls.
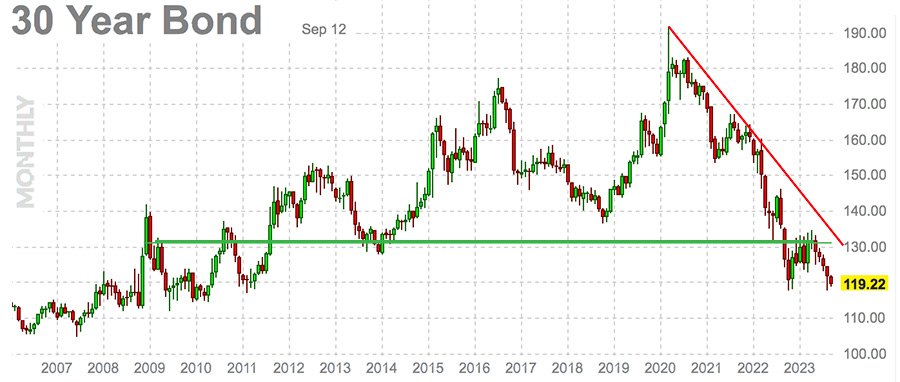
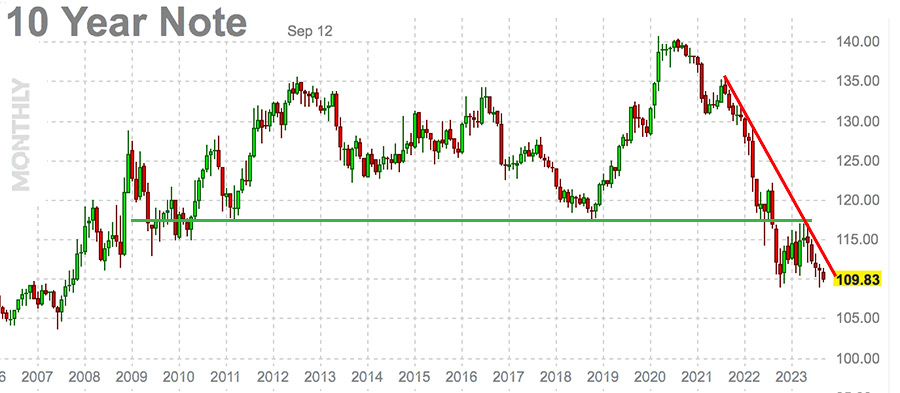
A bank, which counted its 10-year T-Bonds at $140 in 2020, can only count them for $109 and its 30-year bond went from $180 to $119. There is therefore a very sharp fall in the value of the bank's core capital, which served as a guarantee for all its other, more risky operations.
Since 2010, the cumulative new American public debt has amounted to $19,559 billion (see figures from the United States Federal Reserve):
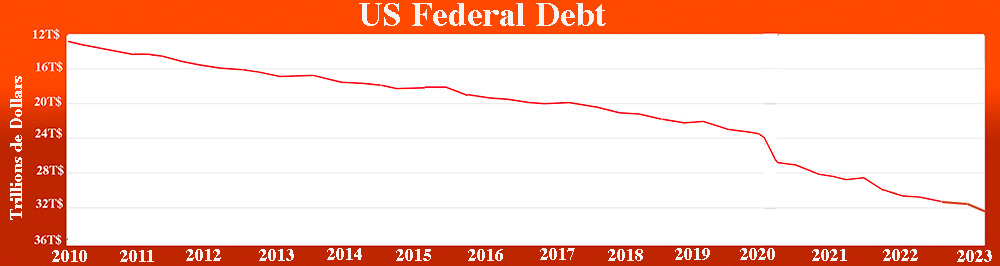
Nearly 70% of this debt is in the hands of American financial institutions, or $13,691 billion in nominal value. But in today's market, this debt would be sold at a very high loss. This is what caused the failure of four big American banks this year (see FDIC).
The Federal Reserve suggested this summer at Jackson Hole that the fight against inflation was not over and that it would be necessary to continue raising rates. The FOMC's monetary policy will be disclosed on September 20. A further rise in rates will automatically cause the value of Treasury bonds to fall on the stock market and could trigger a new wave of bank failures.
Logically, bankers and financial institutions should sell these Treasury bonds, classified Tier One, whose value is falling, to replace them with gold, classified Tier One since January 1, 2023.
Demand for gold from banks is expected to be extremely strong in the last quarter of 2023, especially since the banking crisis risks spreading internationally, as in 2008.
Where is gold going in the short term?
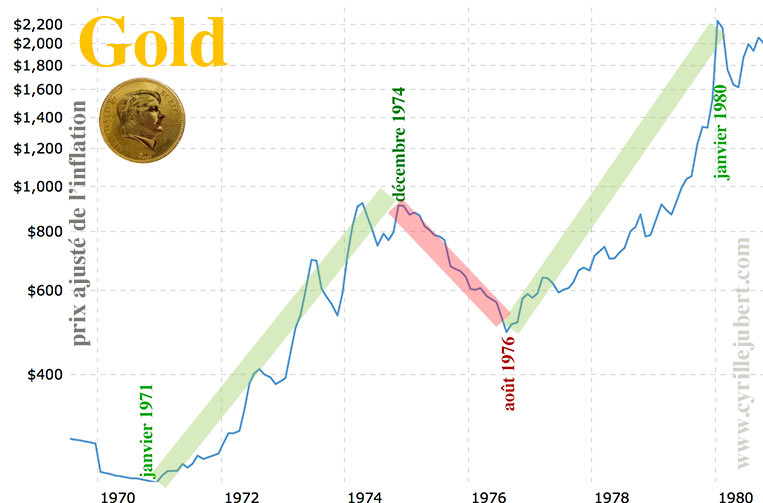
After the collapse of the London Gold Pool, an ounce of gold rose from $32 in 1967 to $850 in 1980 after two big waves of increases, separated by an 18-month consolidation between December 1974 and August 1976.
The price of gold increased fivefold during the first bullish wave from 1967 to 1974.
In August 1976, gold consolidated at $100 before rising to $850. Its price was multiplied by 8.5 during the second wave of increases.
From 1967 to 1980, the price of gold increased 24-fold.
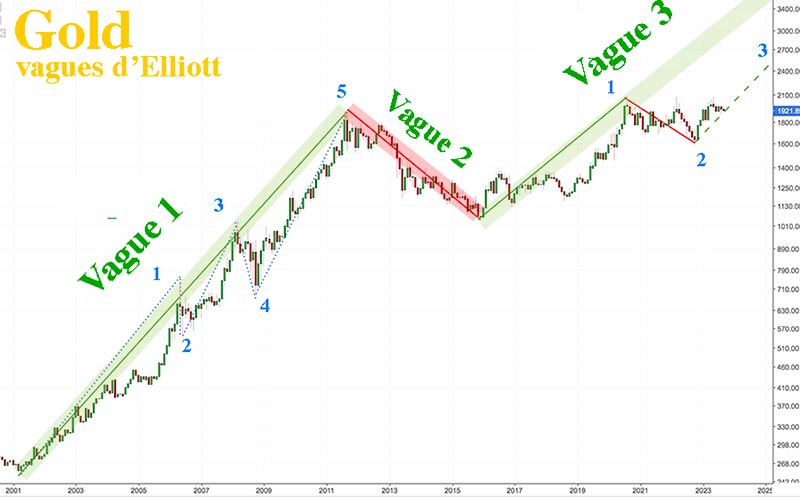
Similarly, gold formed a first major upward leg starting from a low of $255 in March 2001, before reaching a high of $1,929 in August 2011. Its price was multiplied by 7.5.
A long consolidation phase followed, which ended in January 2016, at $1,046, the date of the start of the second leg of the increase.
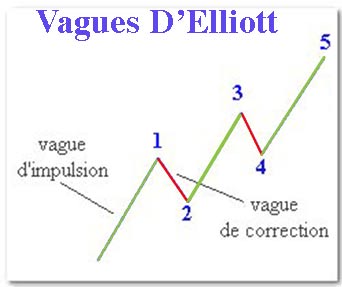
According to Elliott's theory, these large rising waves are broken down into five sub-waves:
During Wave 1, gold rose from $1,046 in January 2016 to $2,064 in August 2020. During wave 2, gold consolidated from $2,064 to $1,620 in October 2022. We We are still only at the start of wave 3, which should greatly exceed the previous historical record. We must then expect a consolidation before the very bullish wave 5.
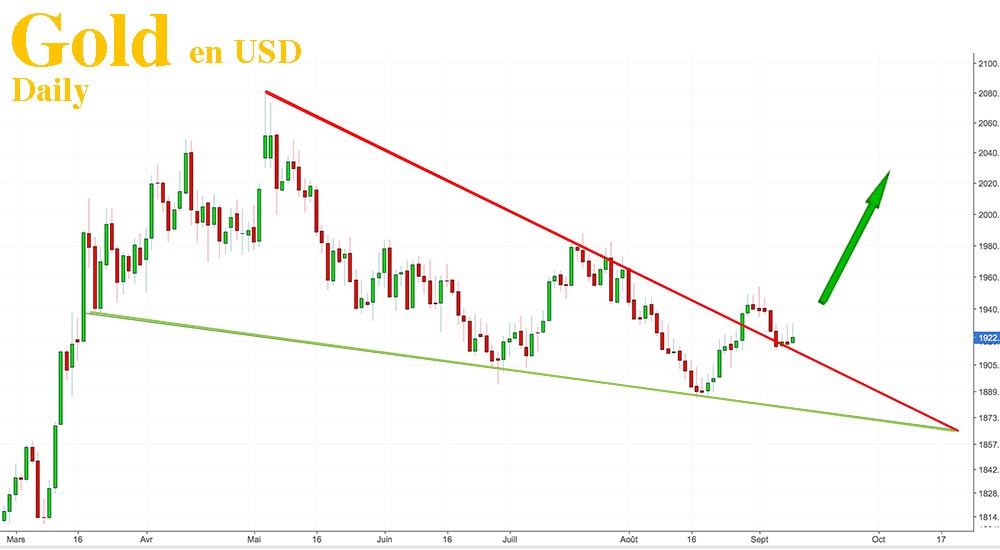
On a daily basis, we see that the price of gold in dollars came out of its bearish wedge and completed the pullback on resistance last week. The yellow metal should therefore begin a new bullish wave.
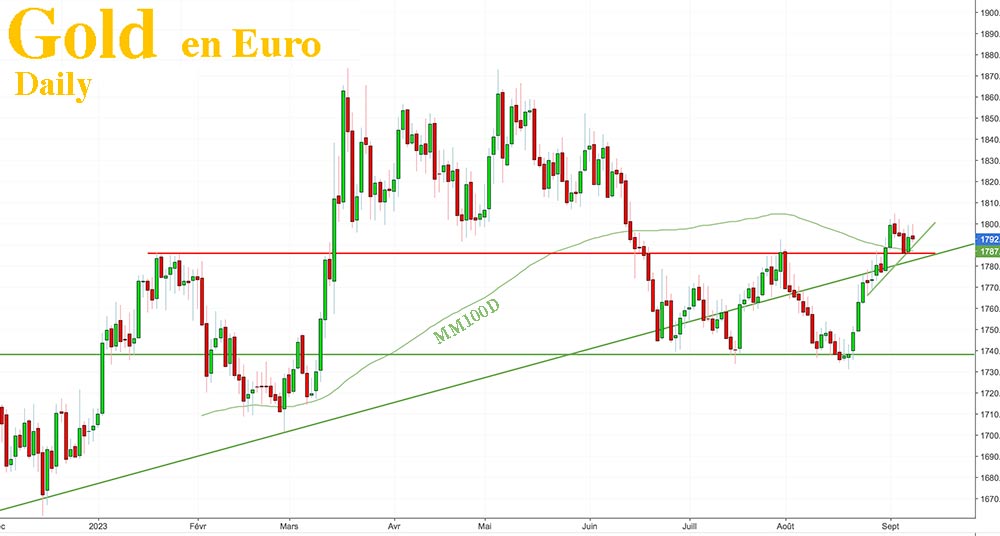
Gold in euros
After a nice upward surge at the end of August, the price of gold in euros formed a horizontal flag consolidation.
The resistance of the flag was broken at the end of last week, and the pullback was made on Friday September 8, while regaining support on the 200H MA, which is very bullish.
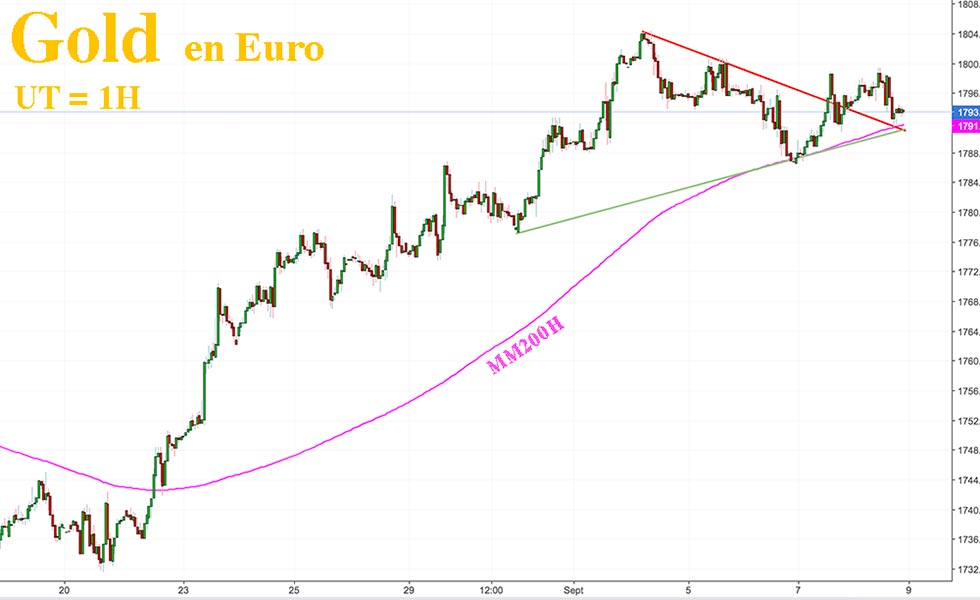
If we look at the daily chart, a big resistance was broken on August 31 and September 1, then a perfect pullback on this resistance was made on September 6, allowing prices to rebound the next day.
Graphically, the first objective of the cup-with-handle figure above is €1,834.
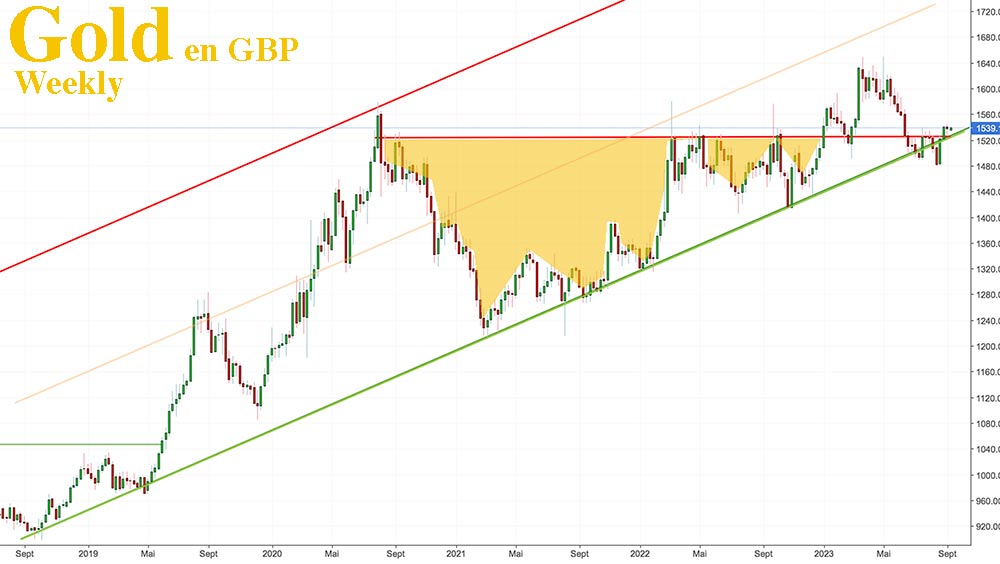
Gold in GB Pound
After the strong bullish surge of 2019-2020, gold in sterling consolidated horizontally, forming a long cup-and-handle pattern, whose resistance line was broken in April-May. The pullback on this resistance was made this summer, and since then prices have rebounded on the bullish oblique support.
Last week, the price returned above all resistance. The primary target for the upcoming rise is £300 higher.
Oil is very bullish
Prices of precious metals, particularly silver, are closely linked to energy prices. Washington massively sold its strategic oil reserves for months to lower the price of a barrel and make people believe that inflation was under control.
Saudi Arabia will extend the voluntary reduction in its oil production, which should increase the price of black gold in the short term.
After Riyadh joined BRICS+ at the same time as Iran and Argentina, the new geopolitical group will control more than half of fossil energy production. Futures prices will no longer be controlled by the United States.
Oil prices had been stuck for several days below resistance at $90.99:
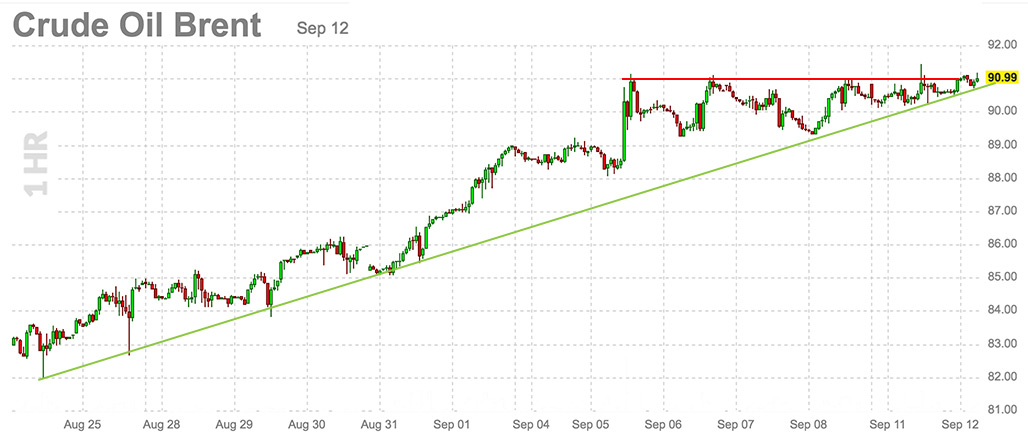
As we can see in this second screenshot, a few hours later, the resistance was broken.
The MA100W is now in support to push prices towards $100:
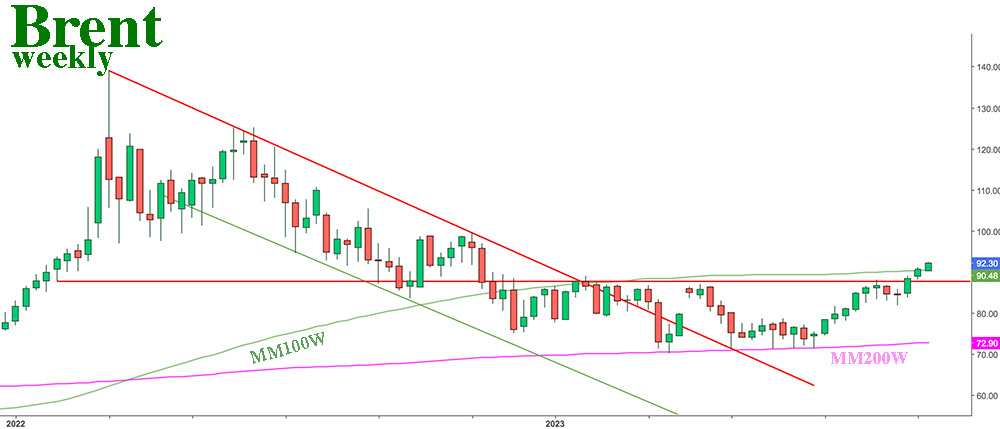
The price of oil should play a major role in the future BRICS+ currency, where a basket of raw materials will guarantee the stability of a basket of currencies according to Sergei Glaziev, who has been working on this subject for several years. A project already proposed at Bretton Woods in 1944 and relayed in November 1980 by The Economist which announced that this new currency would see the light of day in 2018. This project could accelerate with the arrival of Russia as president of BRICS+, the January 1, 2024.
Sugar is bullish
Sugar reacts in parallel to energy prices. It took off in the early 1970s (see the film “Sugar”), forming a speculative bubble, followed by money and the first oil shock. With each surge in money, sugar takes off before its time and makes a bullish rally: 2006 - 2011 - 2016... 2023?
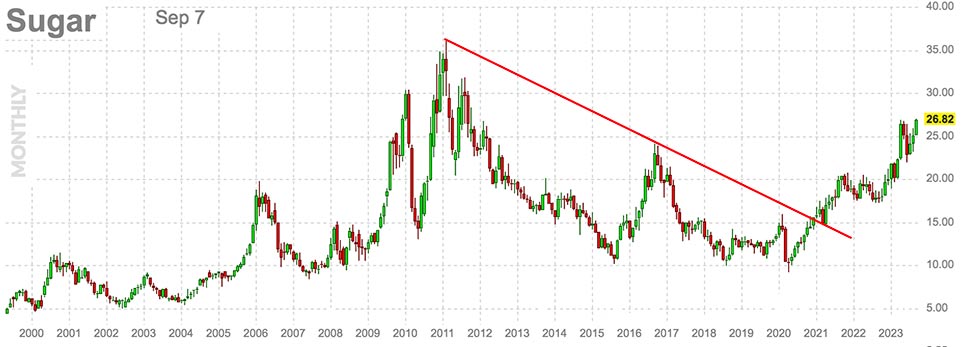
After the first surge of 2020, which made it possible to break the resistance that blocked increases since the high point of 2011, sugar made a pullback before resuming its rise at exactly the same time as silver, in September 2022.
After a strong surge in April 2023, sugar formed a flag consolidation. Resistance was broken last week. Nice increase since then!
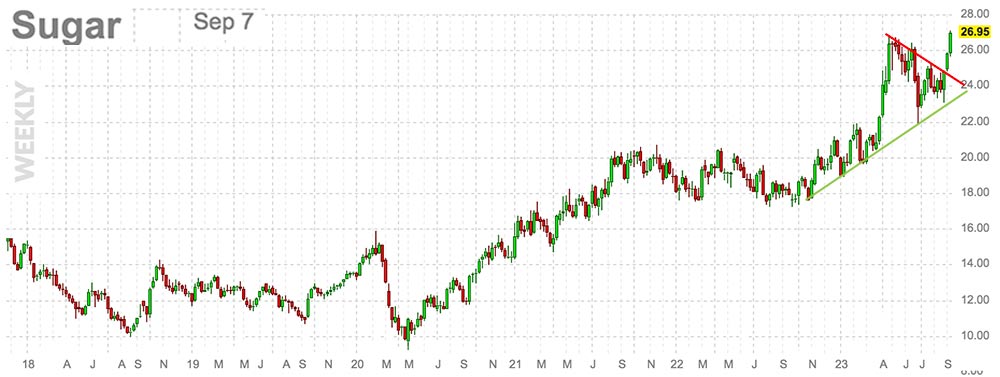
So many reasons which point to an increase in the price of silver in the weeks and months to come. Now is the time to accumulate as much physical metal as possible.
Reproduction, in whole or in part, is authorized as long as it includes all the text hyperlinks and a link back to the original source.
The information contained in this article is for information purposes only and does not constitute investment advice or a recommendation to buy or sell.


