If ever there was a chart to illustrate the radical change that has shaken the markets over the past two years, it's the 10-year UK government bond (Gilts):
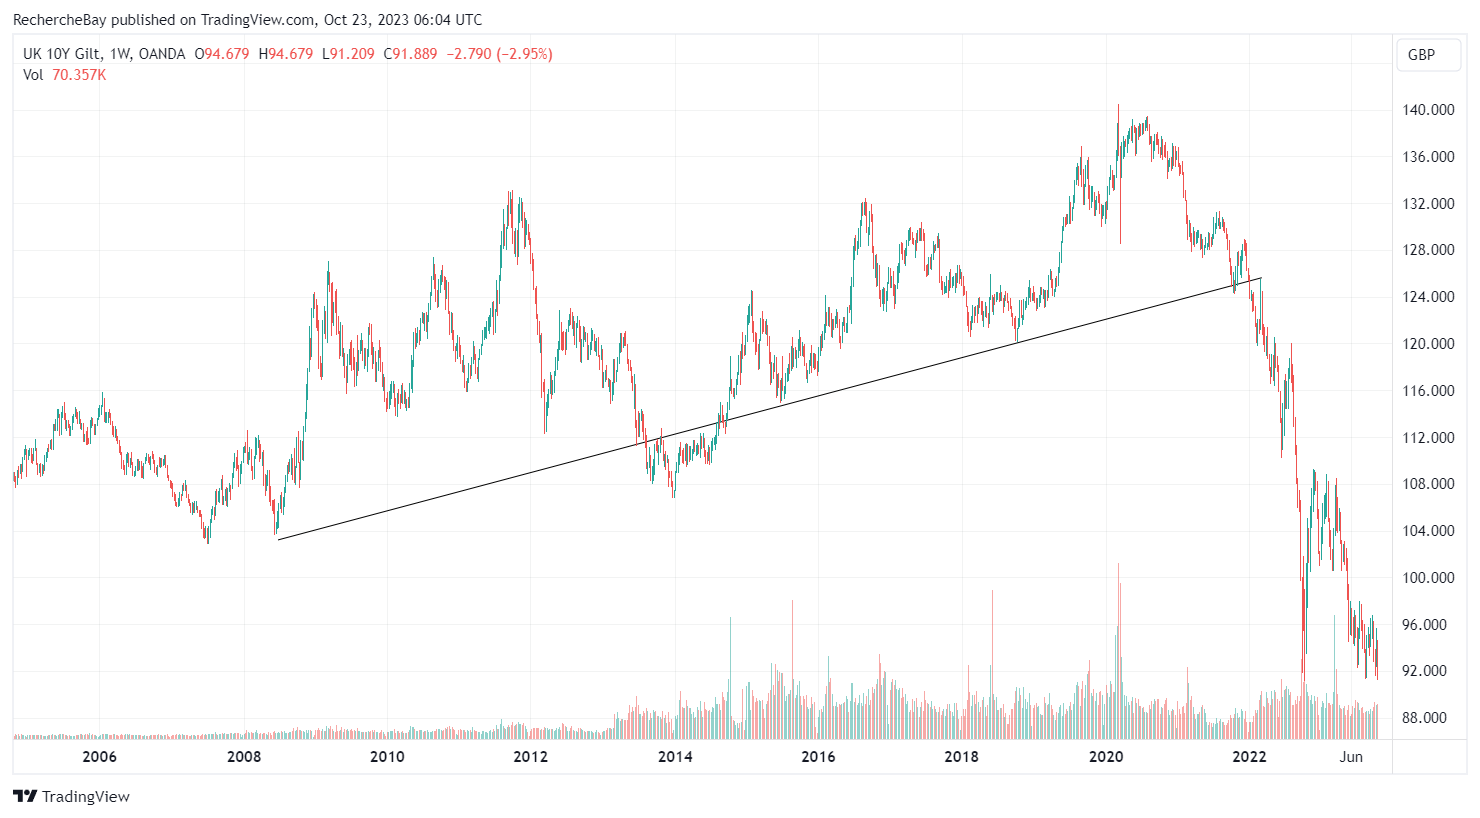
The UK bonds crash is unprecedented.
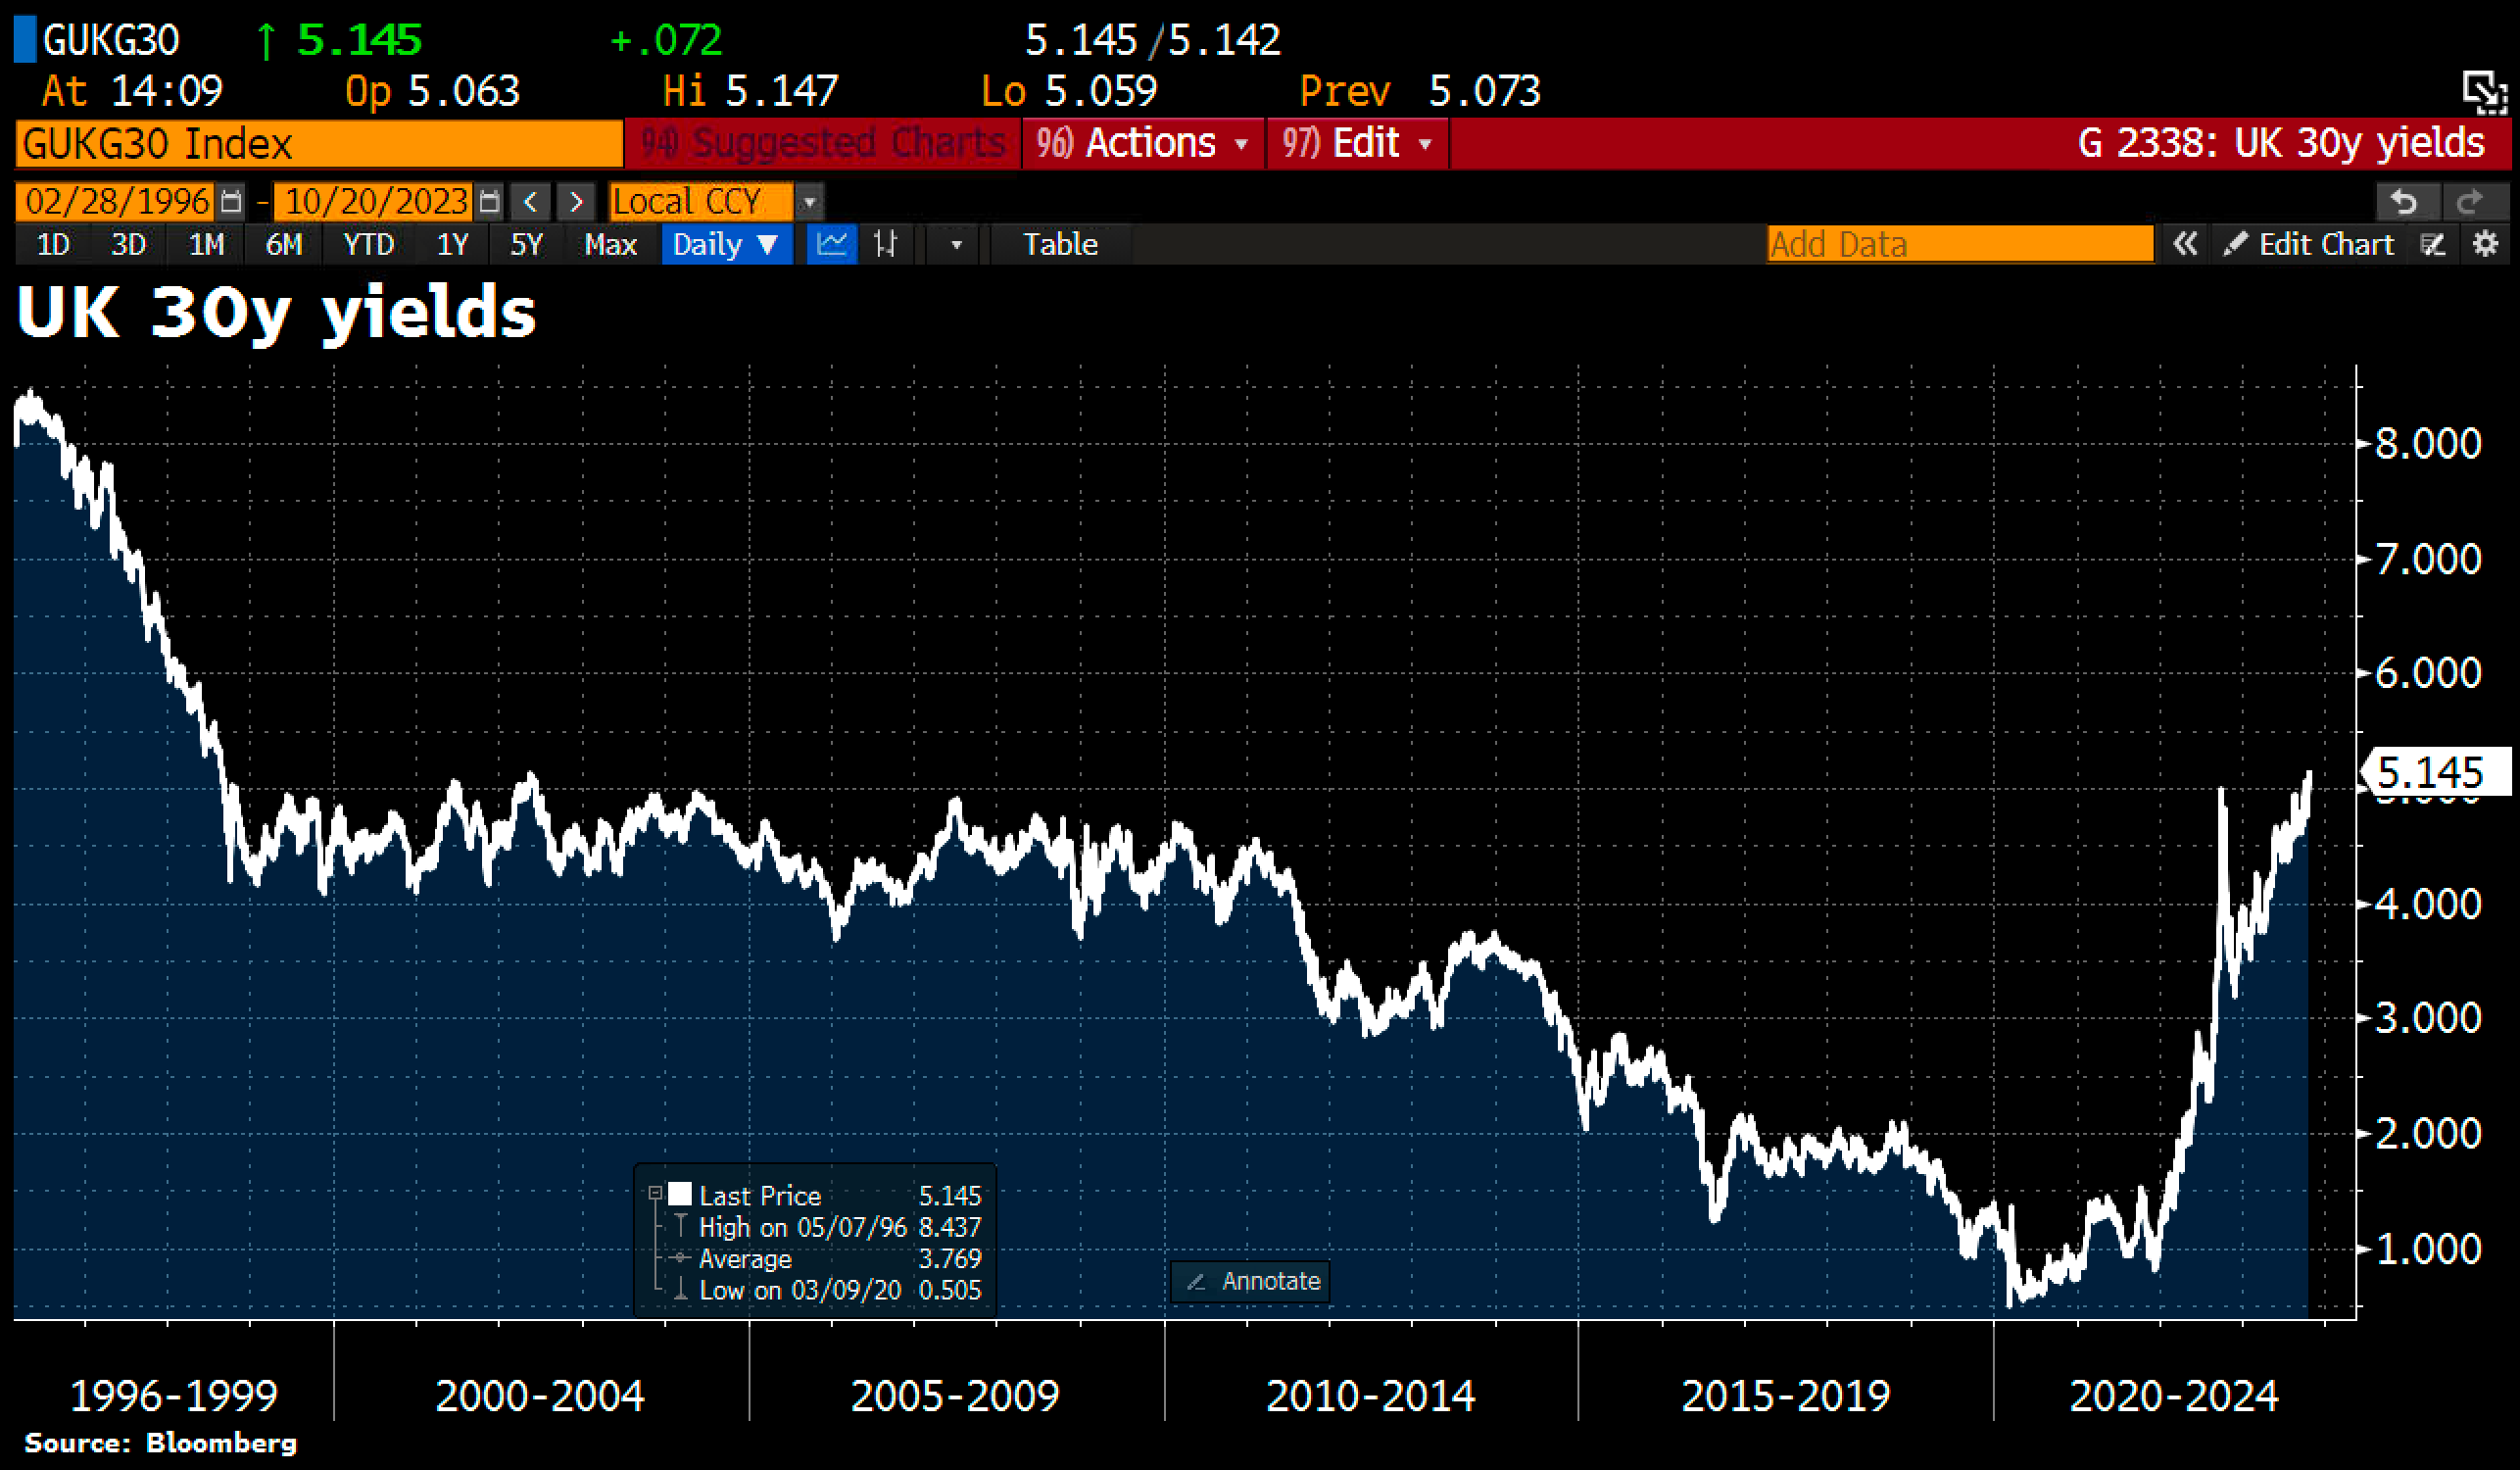
The yield on the 30-year Gilt rose sharply to over 5%, its highest level since 1998:
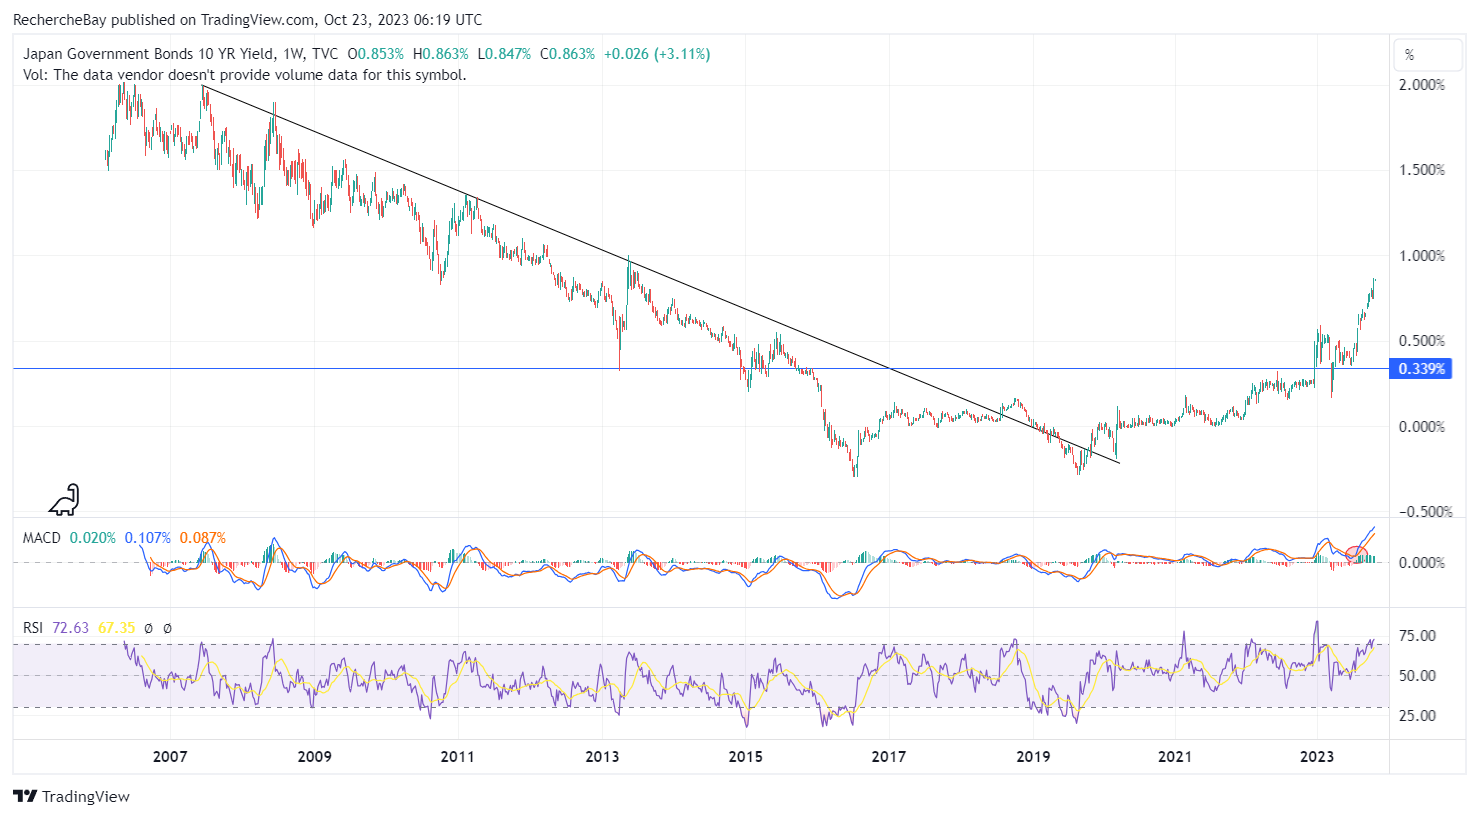
At the same time, the Japanese 10-year is fast approaching 1%, a level that the BoJ has promised to defend:
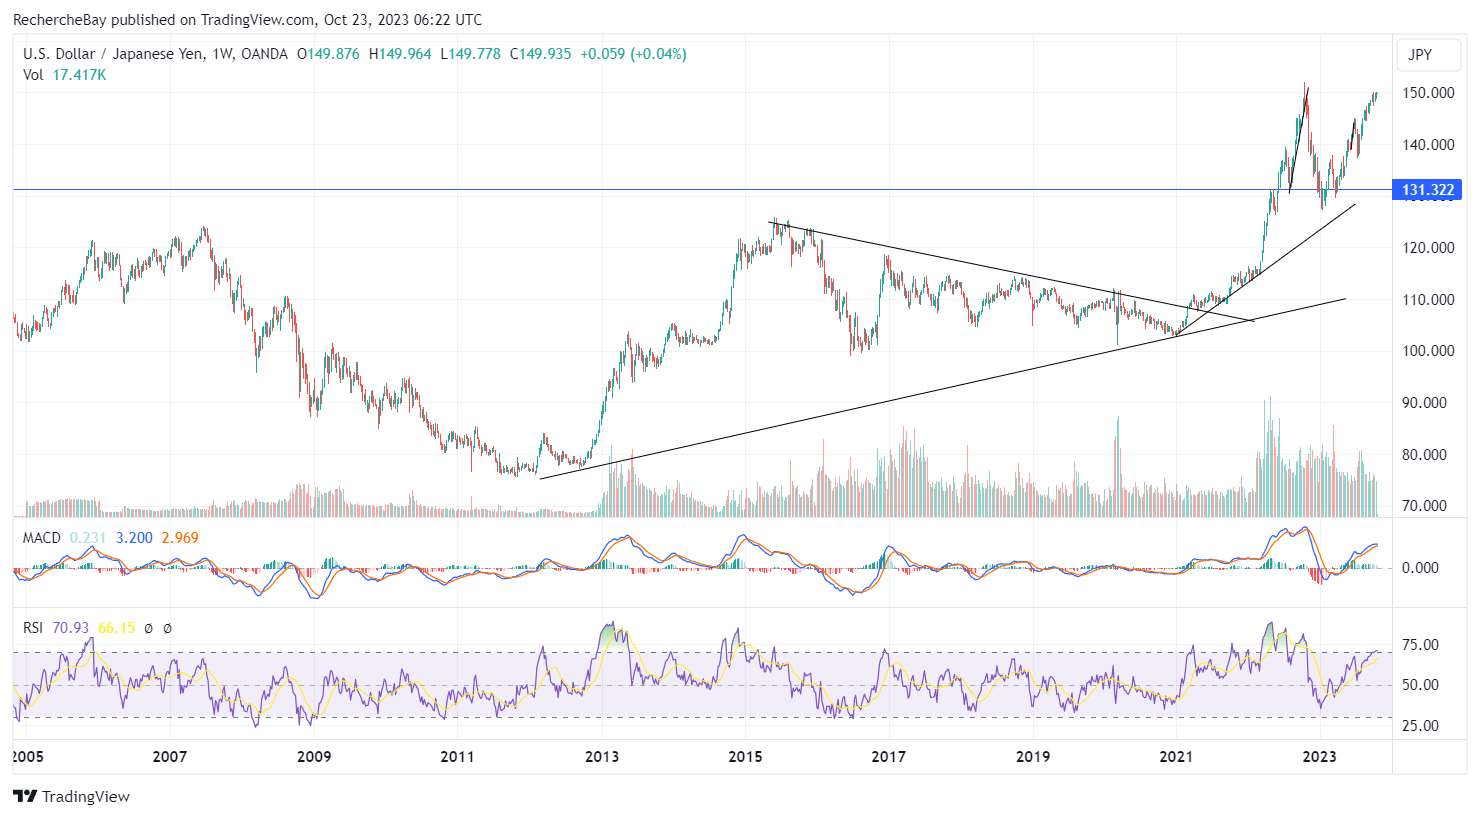
In anticipation of an intervention by the Japanese authorities, the yen resumed its downward trend against the dollar. The greenback was back above the 150 threshold at the start of the week:
The Bank of Japan can only pray that the Middle East conflict does not turn into another oil crisis. With the yen at such a high level, any renewed rise in oil prices would have devastating consequences for the Japanese economy.
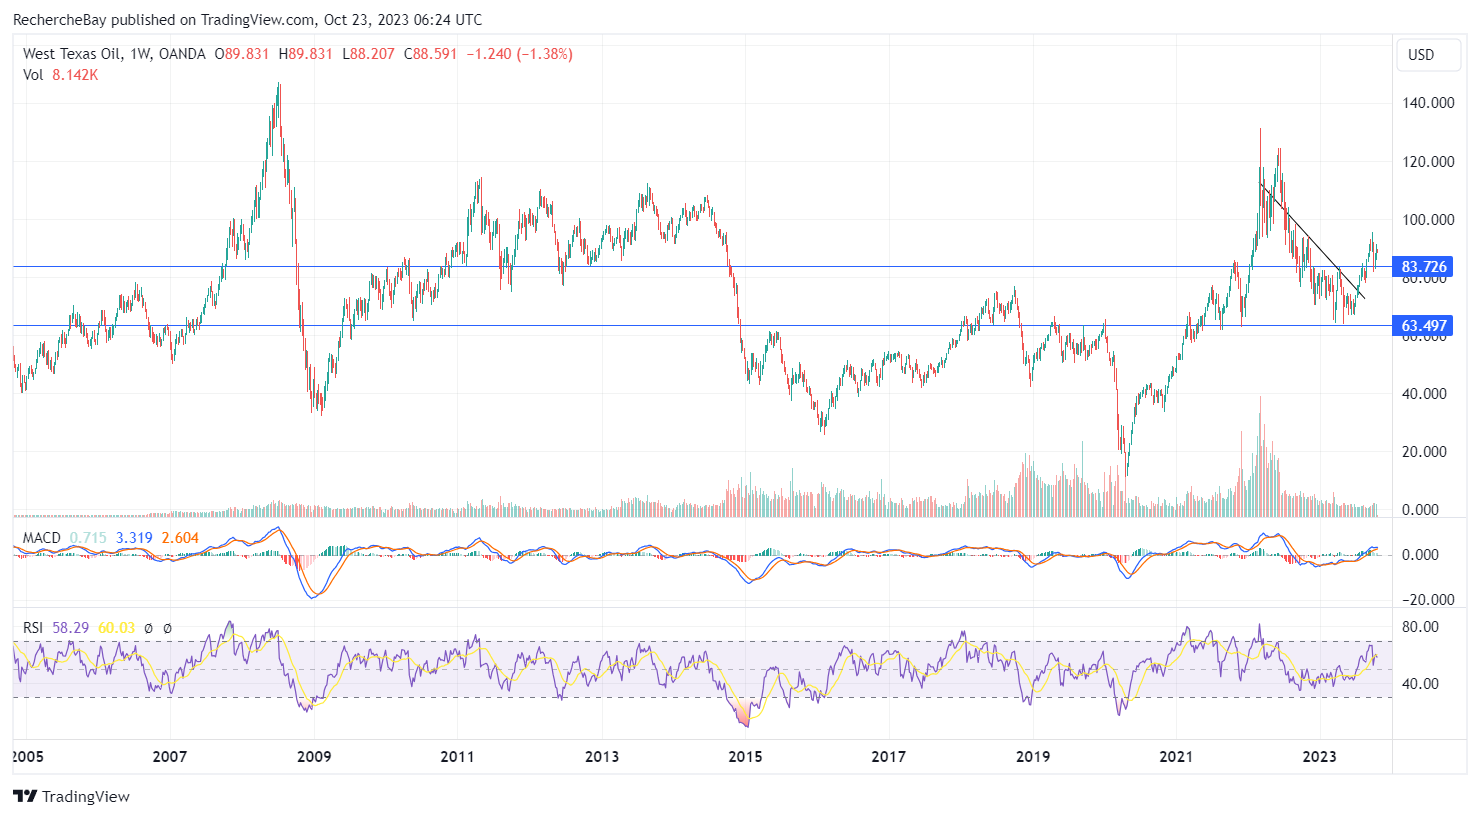
The yen is already in a weak position, while oil is just beginning its new leg up. The BoJ's monetary policy is likely to become even more complicated as Japanese interest rates rise.
A strong dollar, rising real interest rates... Faced with these headwinds, gold should normally correct. But for the past year, as we have explained on several occasions in these bulletins, gold has no longer reacted to movements in real rates.
The following chart perfectly illustrates this decorrelation and gold's behaviour over the past year:
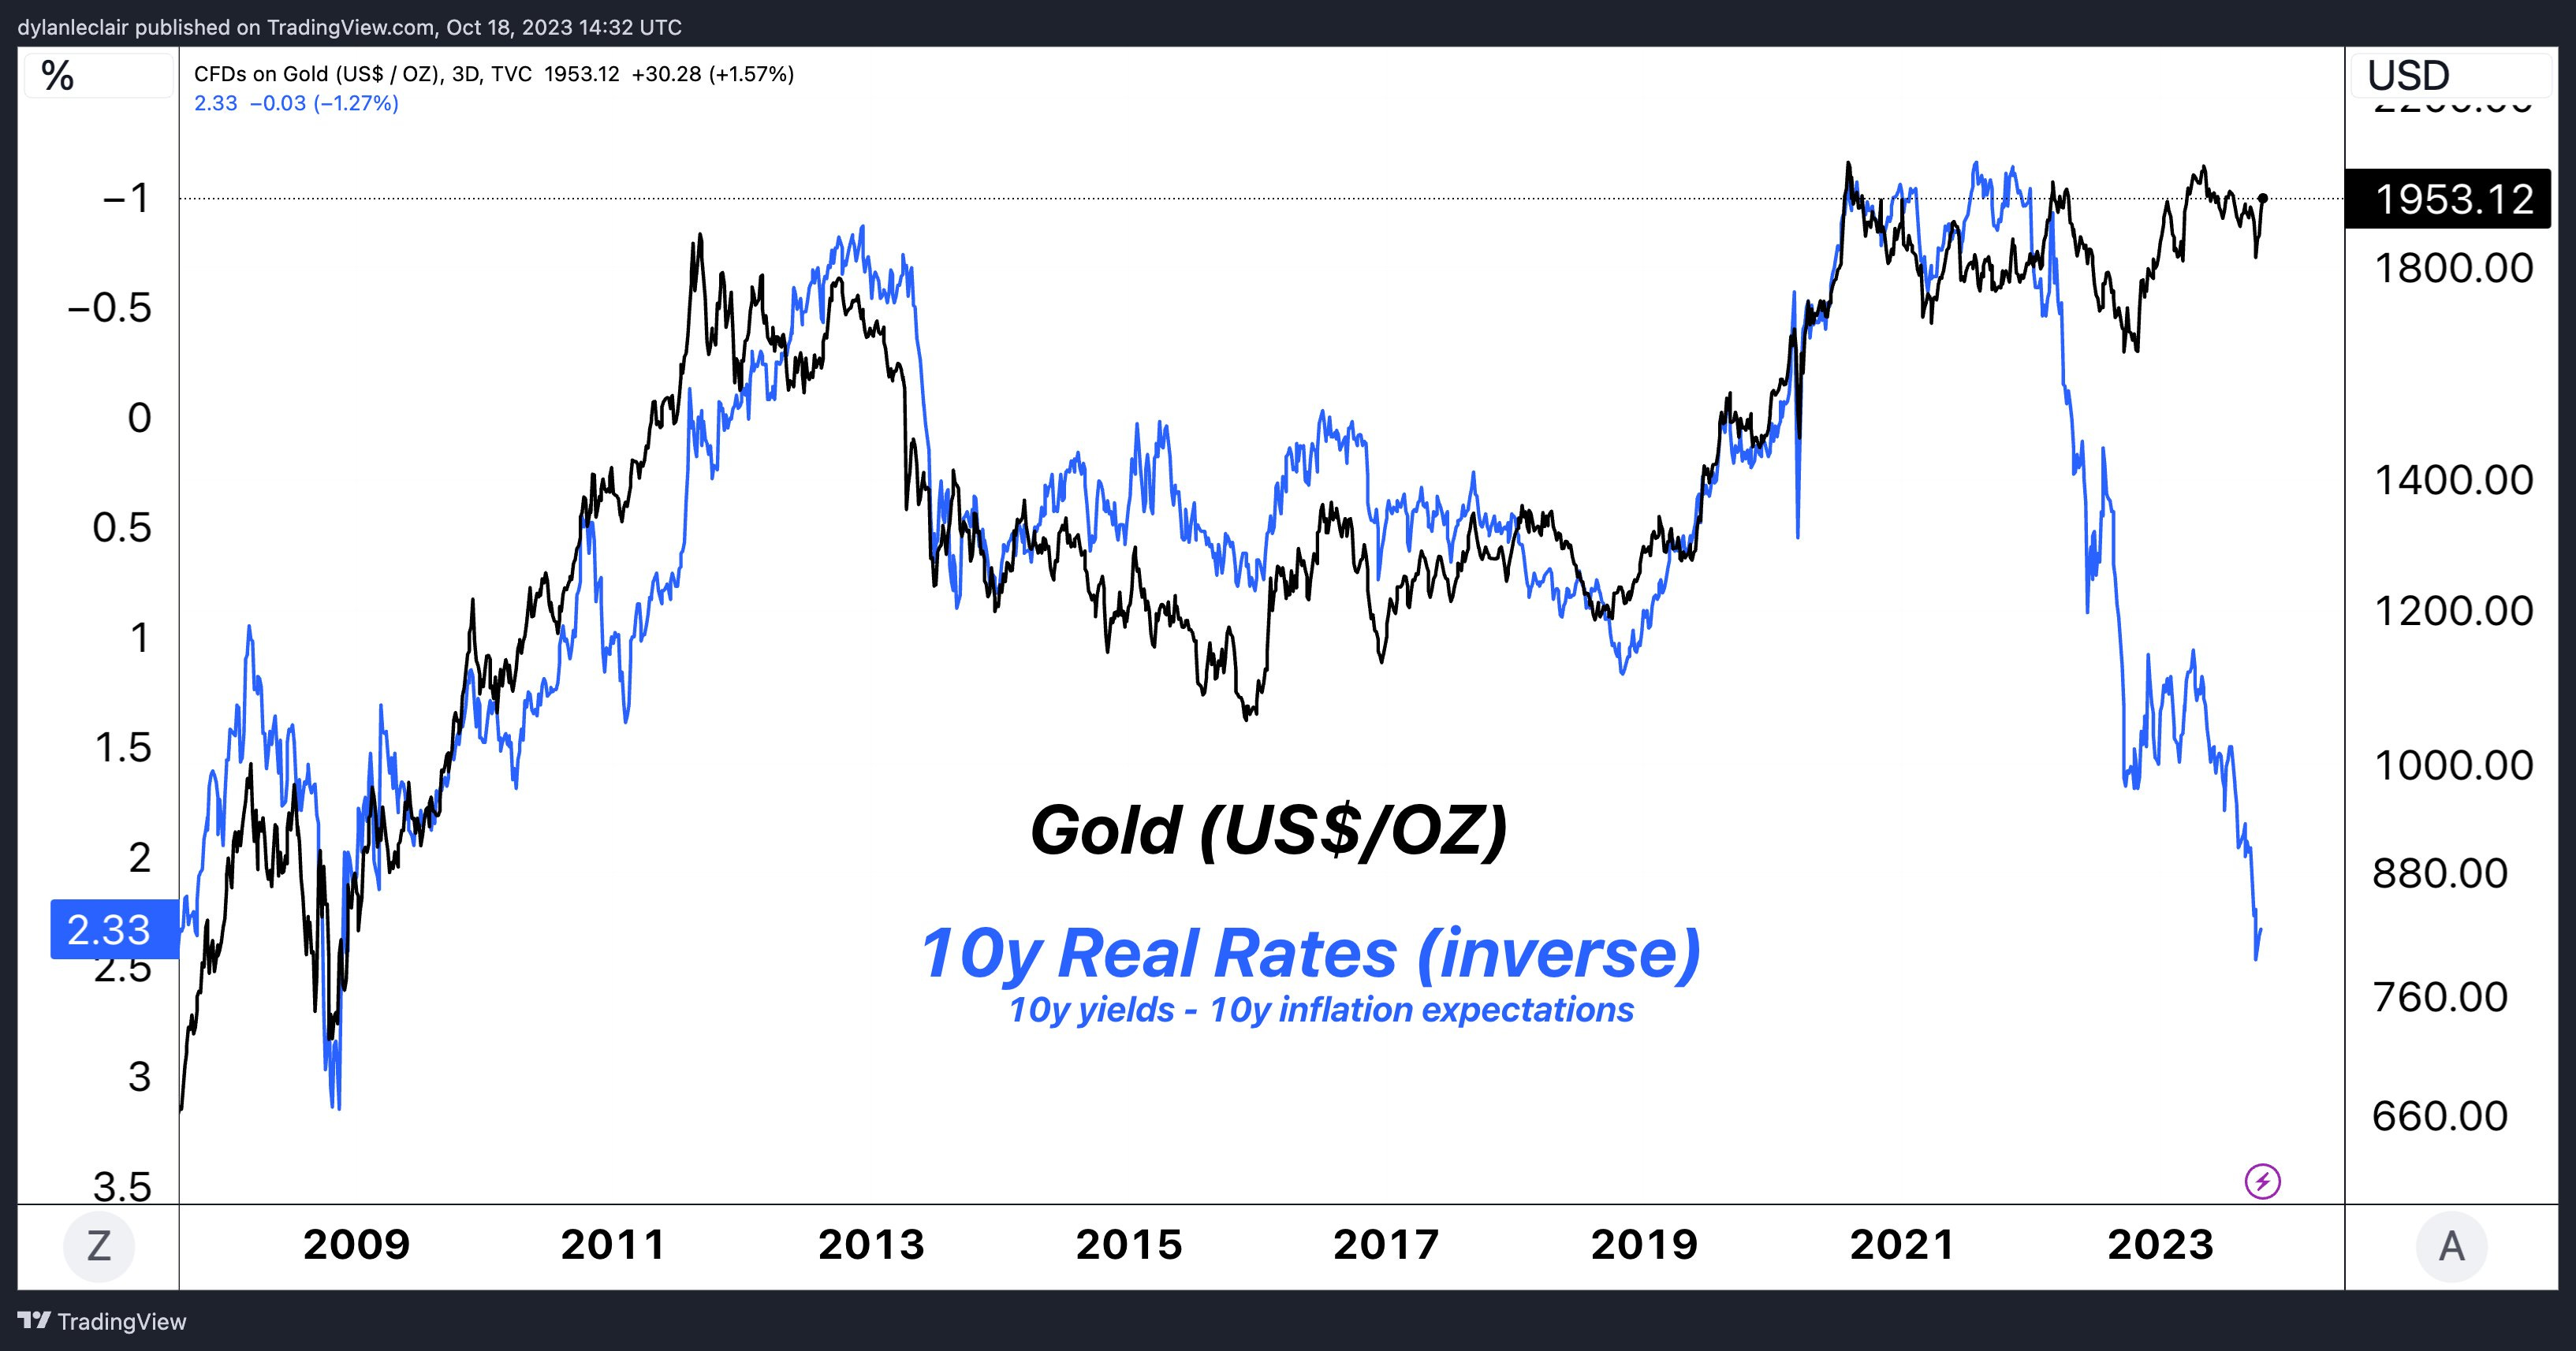
The relationship between gold and real rates broke down when real rates turned positive again. What counts now is the search for solvency, not the search for yield. The return of investment takes precedence over return on investment. If there is a counterparty risk, the investment is discarded. Confidence in the issuer is called into question. Against this backdrop, gold is once again the safe-haven asset par excellence.
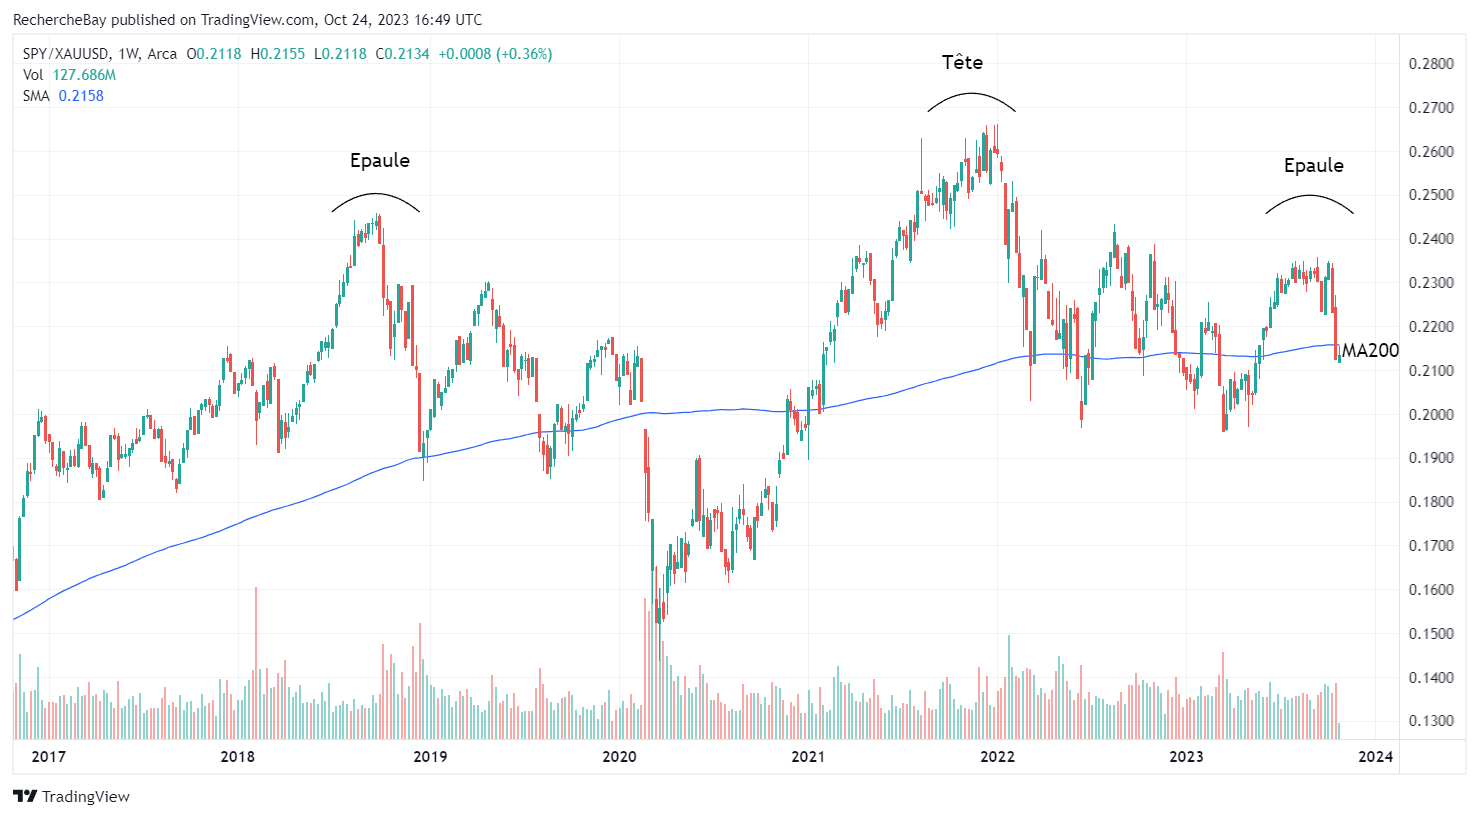
The SPY/GOLD ratio, which measures gold's performance against the equity market, is also on the verge of breaking support. This chart has just traced a bearish "shoulder-head-shoulder" pattern and is attempting to bounce off its 200-day moving average:
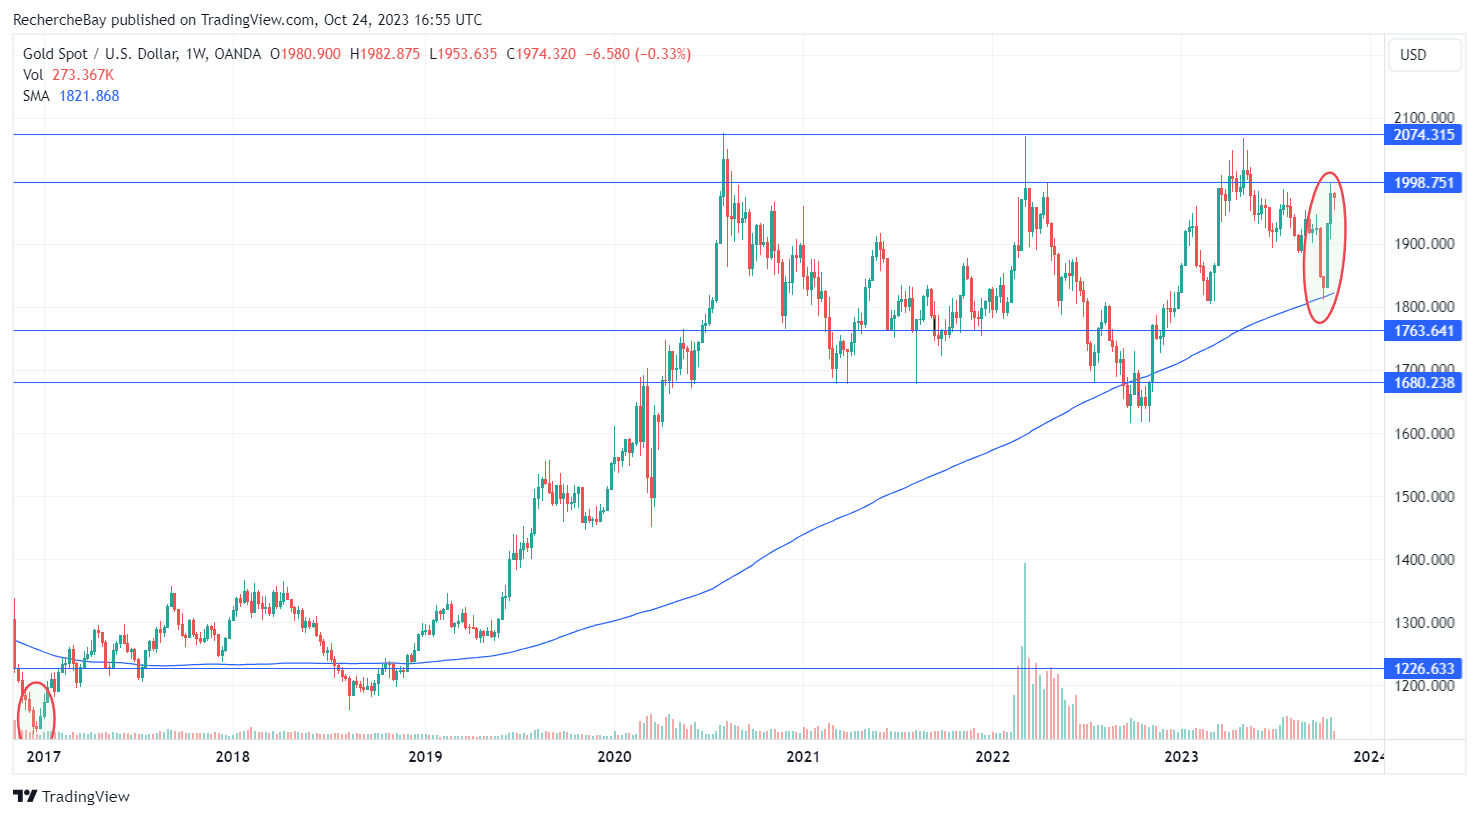
The price of gold, for its part, has just drawn a very fine all-encompassing candle in weekly variation, bouncing off its 200-day moving average. It's a bullish sign that will put even more pressure on COMEX participants defending the $2,000 threshold: these short sellers will have to scramble to avoid gold returning to its uptrend channel.
In monthly variation, we see a very large encompassing candle. This type of monthly bullish signal is very rare for gold:
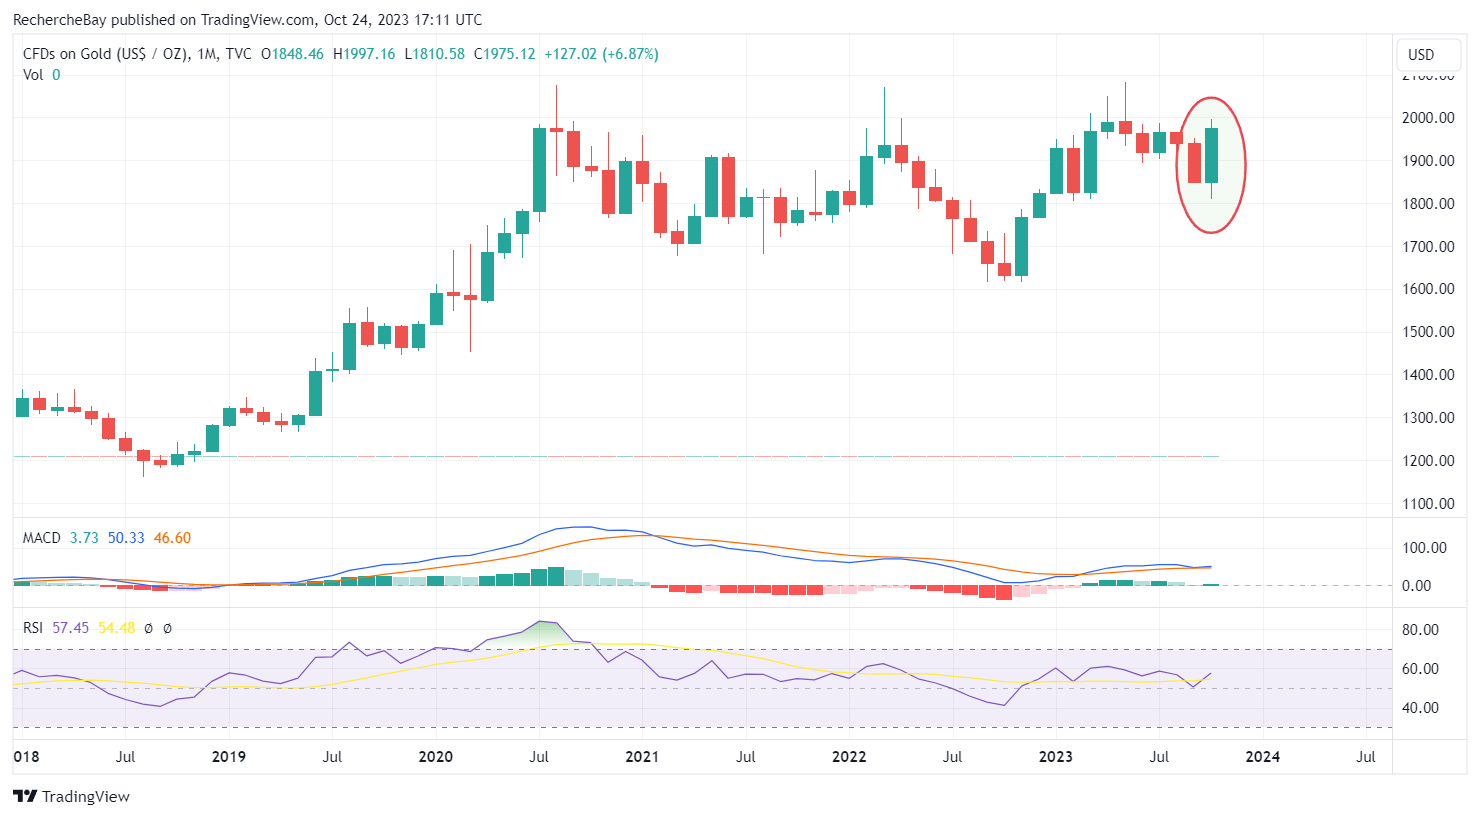
The last time we saw such an all-encompassing candle was in May 1978, before gold's big start following the break of the triple top at $180, and after four long years of consolidation between 1974 and 1978.
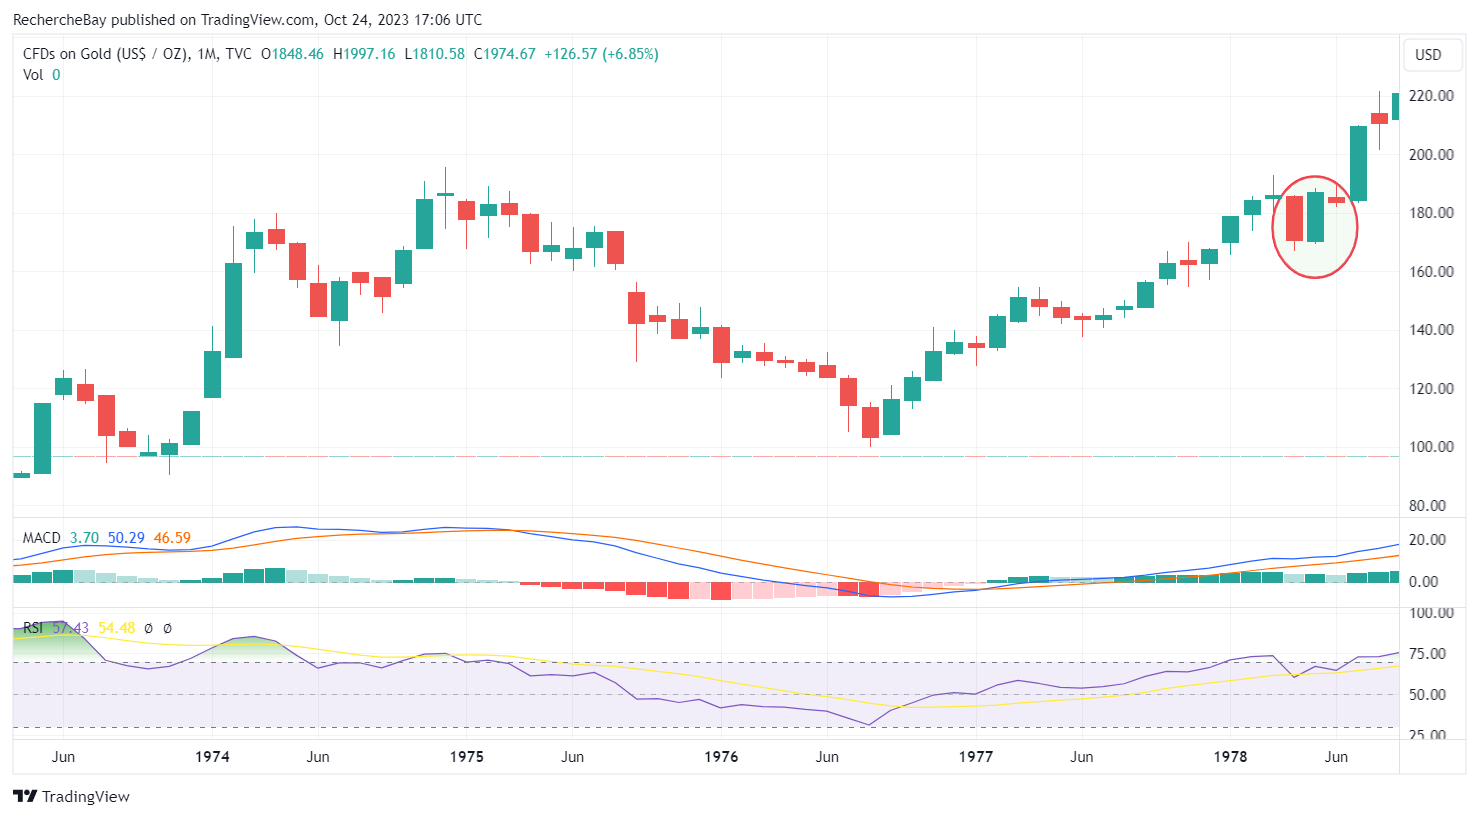
Will history repeat itself? Will gold trigger a new leg higher over the next few months in the wake of this all-encompassing candle?
Reproduction, in whole or in part, is authorized as long as it includes all the text hyperlinks and a link back to the original source.
The information contained in this article is for information purposes only and does not constitute investment advice or a recommendation to buy or sell.


