In the absence of a major bullish catalyst, with interest rate expectations on the rise and stock market indices at or near record highs globally, gold has been consolidating since the intermediate high posted in early September. That high, set just after speeches by the Fed’s Mester, Dudley and George and immediately prior to the beginning of the central bank’s blackout period on September 9th, incidentally coincided with lows on the US dollar and 10-year Treasury yields. Since then, fixed income markets moved from pricing a 69% probability of no change and 31% chance of another hike by the end of the year to almost fully pricing in a 25-basis point move in December (i.e. 96.7% probability of a target rate of 1.25%-1.50% in December).
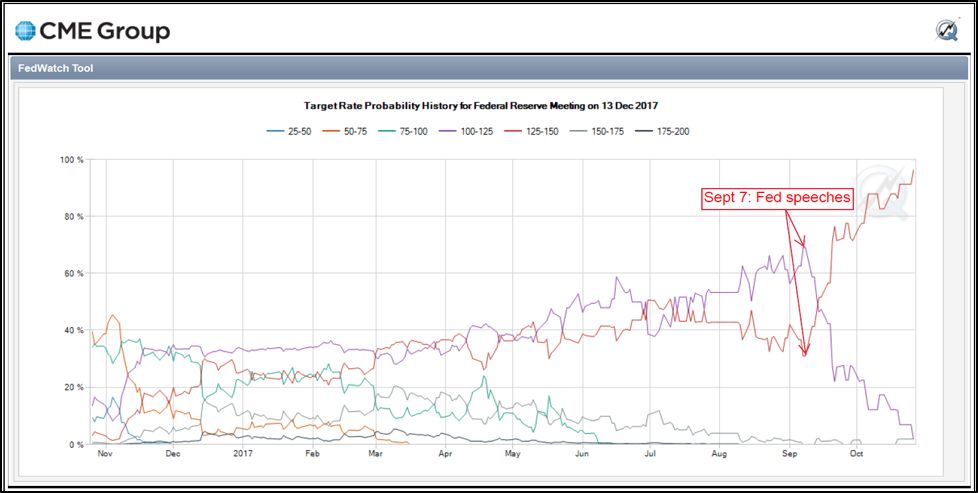
Source: CME
True to its strong negative correlation with government bond yields and the currency (especially with USDJPY) at the moment, the rise in rates and ensuing dollar strength put pressure on gold prices. These correlations, along with short-term technicals, suggest that rising interest rates and a recovery in the dollar may continue to push pressure on gold prices in the short-run.
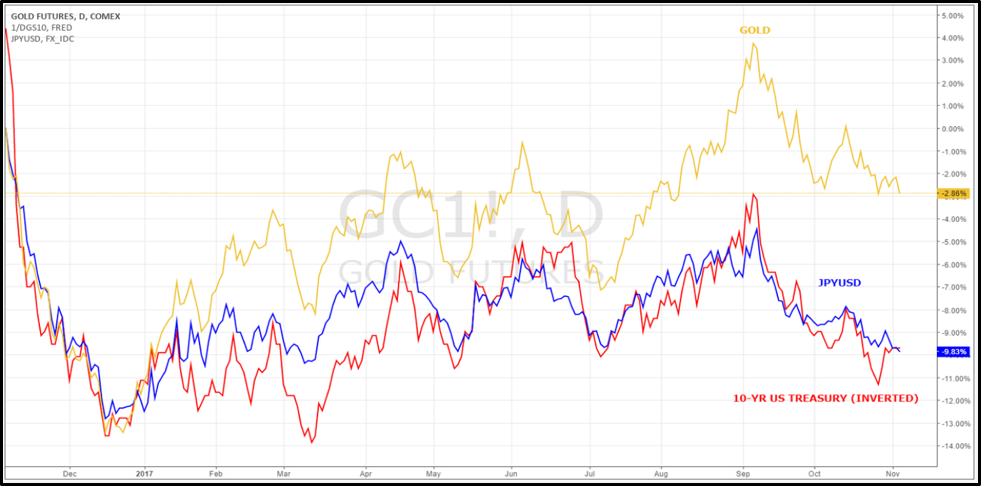
Source: www.tradingview.com
NEW FED CHAIR AND A FLATTENING YIELD CURVE
The intense speculation about the nomination for Fed Chair in recent weeks has finally come to an end as President Trump officially nominated Jerome Powell. Janet Yellen and John B. Taylor were also seen as leading contenders among the purported five finalists which also included Kevin Warsh and Gary Cohn. The consensus view was that a Powell or Yellen nomination would draw less of a negative market reaction given the potential for continuity, whereas Warsh and particularly Taylor winning would have sparked fears of a more hawkish Fed.
In particular some were concerned that Taylor, favored by Vice President Mike Pence, if selected would apply his eponymous rule which by some estimates would currently place r* (the so-called natural or equilibrium rate of interest) above 3.5%. That’s considered hawkish compared to the 2.3%-3.5% in the September dotplot and Fed futures pricing of around 2.00% as a peak for the current tightening cycle in Q2 2020.
Markets are currently expecting the pace of the hiking cycle to remain gradual over the next couple of years. If the pace and expected peak of tightening were to increase significantly without considerably stronger growth and/or rampant inflation, chances are the curve would bear flatten sharply and potentially invert, which historically has been a leading indicator of recession. It’s worth highlighting that in September the 2s10s (spread between the 10-year and 2-year maturities) flattened to its lowest level since 2007. The risk is that if rates rise too quickly, the curve will invert and signal a recession in the following few quarters, which would likely be a bullish development for gold.
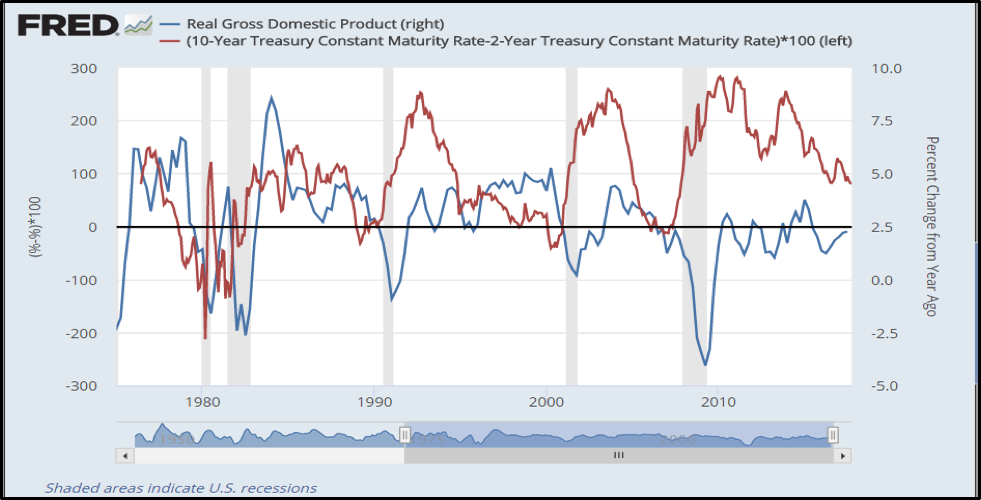
Source: FRED
FISCAL POLICY: HOW HIGH WILL DEFICITS GO?
Another element with far-reaching consequences the markets are currently focused on is the potential for tax reform and the likelihood of expansionary fiscal policy. Both the Trump administration and many in the GOP leadership are keen on lowering income and corporate taxes which, absent the elimination of enough loopholes and deductions, will in all likelihood boost the budget deficit significantly.
Although the Congressional Budget Office (CBO) has yet to weigh in on the new House Republican tax bill, the Joint Committee on Taxation estimates the proposed plan will add $1.49 trillion to the deficit over a decade. That’s over 7% of the Real GDP that the CBO projects for 2027. It’s well worth noting that, not surprisingly, rising government debt to GDP in the US has clearly been associated with stronger gold prices over the past 50 years.
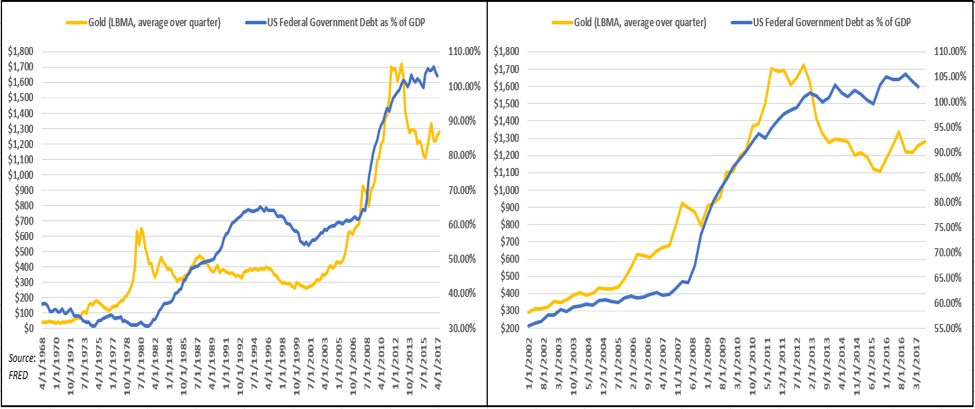
Source: FRED
DOLLAR BOUNCE TO BE SHORT-LIVED?
In the longer-term, substantial increases in the twin deficits would certainly prove bearish for the dollar. In addition, the end of the US dollar’s hegemony as the world’s reserve currency, especially if precipitated by China’s moves to help break the Petrodollar system as eloquently put by Fabrice Drouin Ristori here, is another crucial long-term element for the greenback.
From a technical perspective, as recently pointed out by a number of observers the DXY appears to be in a broadening top formation since March 2015, having just recently bounced off trendline support. If the broadening pattern is in fact triggered on a break below 91.01, dollar weakness should continue in earnest to the next Fibonacci support zone at 88.45/87.25 but more likely towards 84.60/83.35, the current target for a bearish exit out of the reversal pattern.
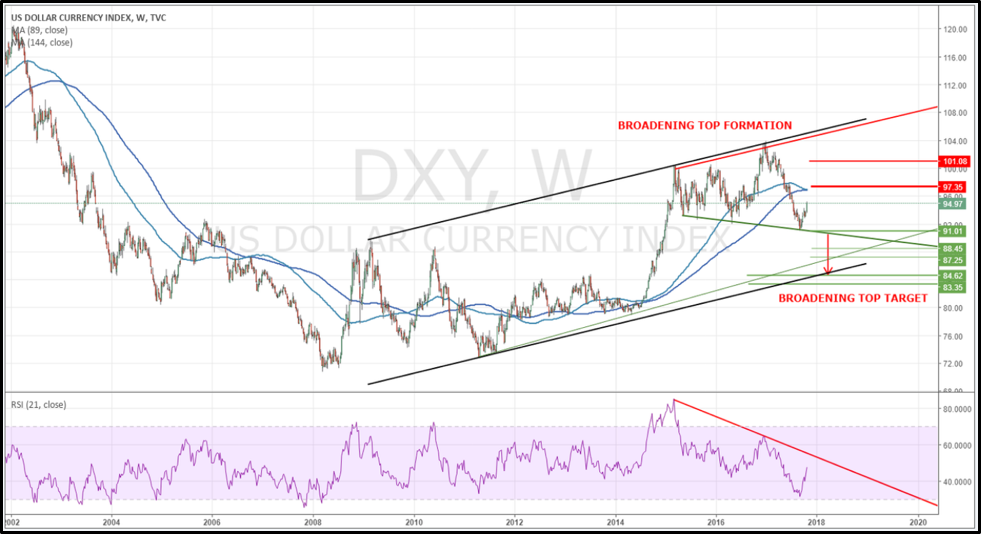
Source: www.tradingview.com
However, in the short-term the dollar looks oversold and the recent bounce should be expected to continue. The DXY appears to have triggered an inverse head and shoulders pattern with a potential target around 97.35, with a bullish divergence on the RSI to boot. Nevertheless, as long as the dollar index remains below 97.42 (50% retracement of the move since the 103.82 high) or even 101.08 (78.6% retracement) in a dead cat bounce, the correction should then resume.
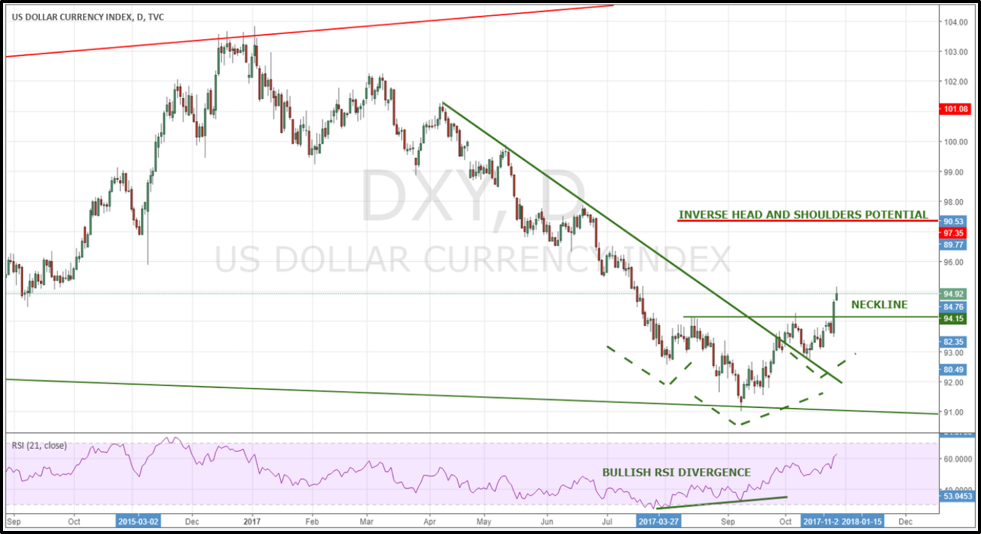
Source: www.tradingview.com
CONCLUSION
Driven by higher rates and a stronger dollar, the correction in gold prices since the September 7th high has proceeded with declining volume and open interest in COMEX. This is typically indicative of a consolidation rather than a new trend, with the overall longer-term bull market remaining intact. A short-term bounce in the US dollar, which suggests gold may continue to consolidate for the time being, should provide interesting entry points for those looking to profit from the resumption of the longer-term rally in the precious metal.
Reproduction, in whole or in part, is authorized as long as it includes all the text hyperlinks and a link back to the original source.
The information contained in this article is for information purposes only and does not constitute investment advice or a recommendation to buy or sell.


