On Friday, both the S&P 500 and the Nasdaq composite indices closed at record highs in the US, with the Dow Jones Industrial Average only a whisker away from its peak set in March. What has often been called the “most hated bull market in history” continues thus far to chug along in defiance of its detractors.
There are certainly plenty of reasons to believe US equities are overvalued and that stocks may be reaching a major cyclical high. Equity valuations are not cheap by almost any measure, real GDP growth remains at a tepid 2% YoY pace, and short-term interest rates are finally on the rise.
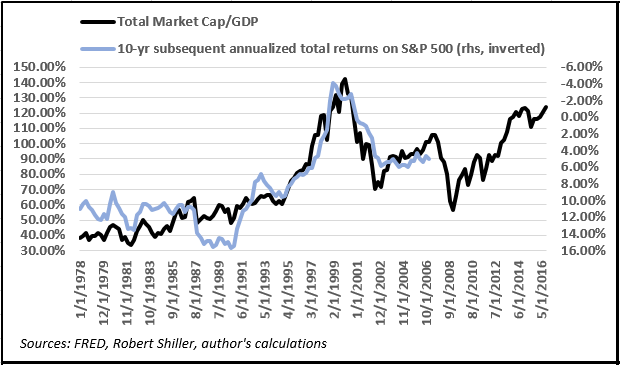
While there is always the possibility that a major bullish move may be in the works for stocks, potentially on the back of “Trumponomics”, it is well worth considering at this juncture what Warren Buffett once called “probably the best single measure of where valuations stand at any given moment”. The ratio of total stock market capitalization to GDP, a favored indicator of the “Oracle of Omaha”, has historically proven to be a very useful and reliable harbinger of longer-term future returns in equities in the US.
It’s important to point out that current levels of the ratio at nearly 130% imply negative total returns on equities over the next decade, meaning dividends will likely be unable to offset capital depreciation. Ominously, the ratio hasn’t been this high since Q3 2000, when the market was near the very top of the Internet bubble. Investors with a 10-year horizon who bought into equities during that period eventually earned annualized total returns of -2.84%, meaning they lost over 25% of their capital in nominal terms. This has very interesting implications for gold prices.
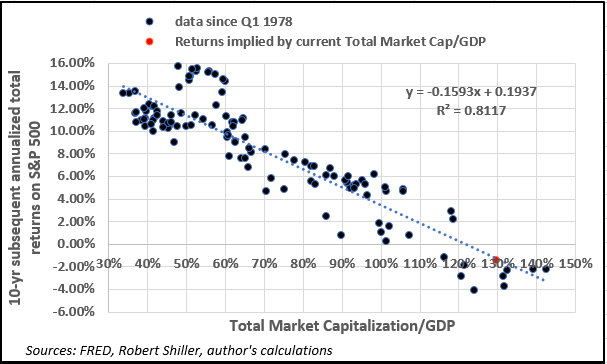
Let’s consider the relationship between the “Buffett indicator” and subsequent 10-year returns on the S&P 500 since 1978, as it allows us to draw a comparison with the data available for LBMA gold prices. Given the nearly 40-year correlation, a statistically significant linear regression suggests the metric currently is consistent with annualized total S&P returns of -1.27% from now until Q1 2027, for a total nominal return of around -12%. In other words, a “buy and hold” strategy in US equities at the moment appears to be a losing proposition for the next decade. Interestingly, for every 10% increase in the ratio there’s a nearly 1.6% decline in prospective S&P 500 returns, as shown in the diagram below.
Now consider the correlation between returns on the S&P and those for gold over a 10-year holding period. Not surprisingly, the correlation is also negative as well as statistically significant. In other words, lower equity returns over a 10-year period have been clearly consistent with higher returns for the precious metal. Specifically, using data since January 1978, every 1% drop in annualized total returns on the S&P 500 implies a 1.5% increase in returns on gold. At present, annualized S&P returns for the past 10 years at 5% are consistent with gold returns of 8.30%, compared to the actual returns of 6.51%.
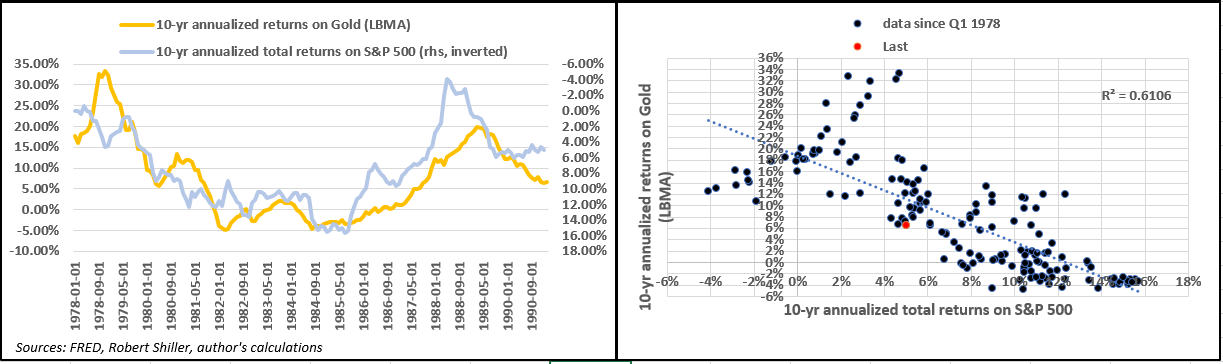
Now, here’s the main point. Prospective annualized total returns of -1.27% on the S&P over the next 10 years would be consistent with returns for gold of around 20.6% on average per year. These are very enticing returns for any asset class over a 10-year period and one that would make any portfolio manager envious: they are literally Warren Buffett-like returns. In addition, since 1978 the annualized total return required for the S&P to outperform gold stands at 7.44%. In other words, when equity returns are below that, investors are better off owning gold than they are large-cap stocks.
The very real prospect of negative equity returns over the next decade alone provides a compelling case for using gold as a hedge, and investors seeking capital preservation may wish to include the metal in their asset allocation. Given present levels of stock market capitalization to GDP and prospective equity returns, it would be reasonable to expect 15%-20% returns per year for gold over the next decade. The monetary experiment led by the world’s major central banks by way of quantitative easing has done much to inflate asset prices since the global financial crisis, and at this point having an allocation in gold appears very sensible.
Reproduction, in whole or in part, is authorized as long as it includes all the text hyperlinks and a link back to the original source.
The information contained in this article is for information purposes only and does not constitute investment advice or a recommendation to buy or sell.


