After posting a solid performance over the summer, gold is on the verge of testing what can be considered major technical resistance around $1378. The precious metal may be about to get its shine back in a big way, as a number of significant technical developments suggest a strong potential for the resumption of the bullish medium- and long-term trend.
RISING VOLUME AND OPEN INTEREST MEANS INCREASING DEMAND
Spurred on by geopolitical tensions in the Korean Peninsula along with lower interest rate expectations in the US and a weaker dollar, trading on COMEX futures reached a record volume of over 6.8 million contracts in August. The uptrend in volume, which interestingly started in December 2015 just as the Fed began its interest rate “lift-off”, is clearly a positive signal for the precious metal given the bullish trend in prices, as demonstrated by past bull markets and as generally accepted by most technical analysts. Notice for instance the uptrend in volume during the major bullish accelerations of 2002 to 2008 and 2009 to 2011, two instances in which gold prices more than doubled.
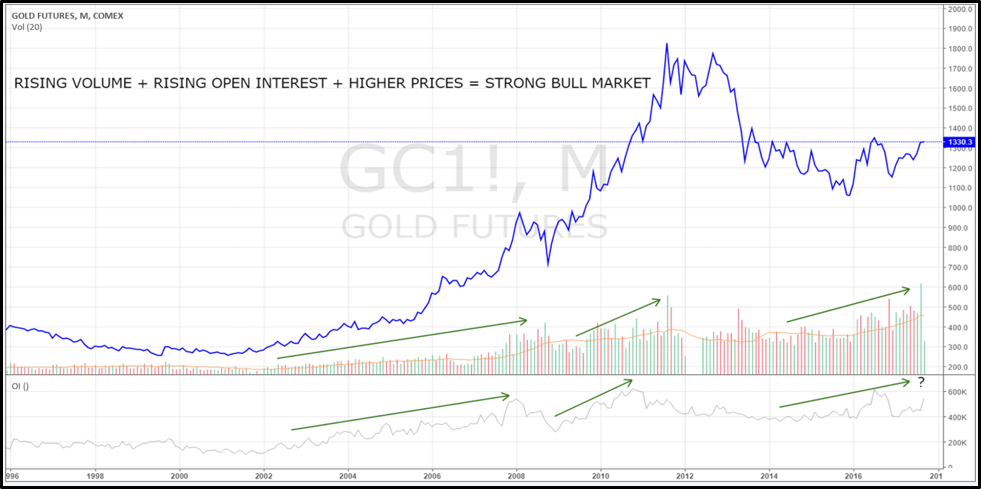
Source: www.tradingview.com
In addition to increasing volume, another significant technical development is the sharp rise in open interest, which also points to growing demand for gold. It is also generally accepted that rising volume and open interest with higher prices is a bullish sign as new money enters the market and, historically, increasing levels of open interest have in fact been consistent with higher gold prices. Taken at face value, current levels of open interest would be suggestive of far higher prices: regressions would imply prices at $1450 or even $1800.
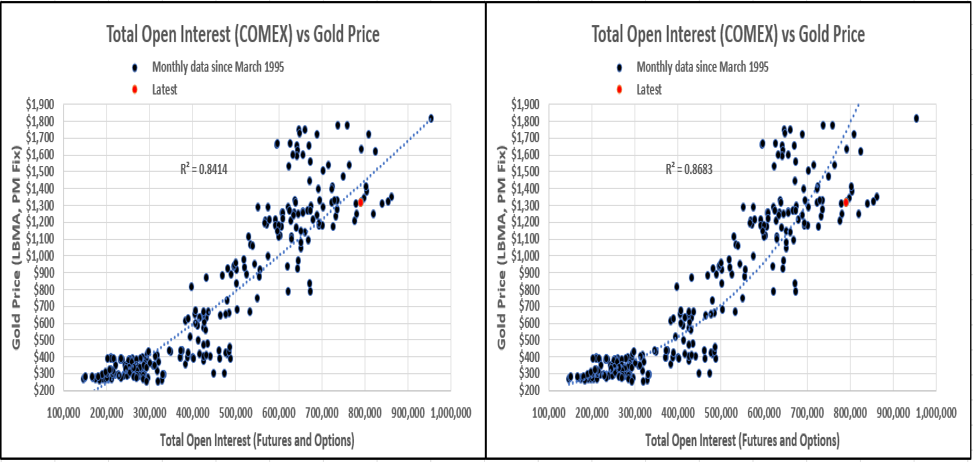
Sources: CFTC, FRED, author's calculations
INVERSE HEAD AND SHOULDERS SUGGESTS RALLY TO $1700
The volume configuration is particularly noteworthy in light of the potential inverse head and shoulders pattern I mentioned back in March. Notice that the “head” of the pattern (ie the absolute low of the downtrend at $1045.4) was shaped on very low volume, while the break above the first trendline resistance in early 2016 was accomplished on increasing volume. Note that the breach above the second trendline resistance, which established the downtrend since all-time high in 2011, was also achieved on rising volume. It may be worth noting here that the trendline has been tested six times, which attests to its importance. Although the longer-term reversal pattern has yet to be triggered, thus far the price action conforms very well with a classical inverse head and shoulders configuration.
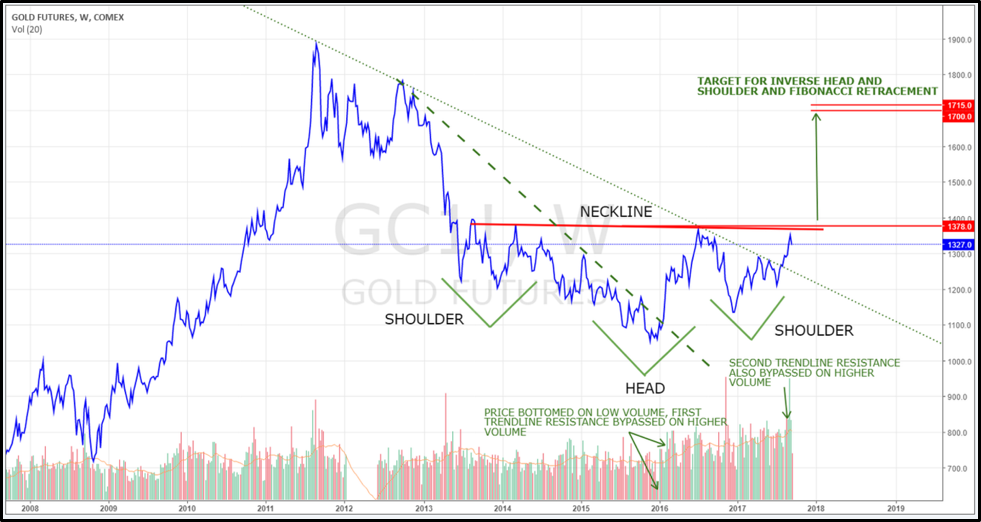
Source: www.tradingview.com
The neckline of the inverse head and shoulders appears to be around $1378, which roughly corresponds to the 38.2% retracement of the bearish correction from the 2011 all-time high to the 2015 low. A clean break above this level, preferably on high volume and followed by a confirmation pullback for good measure, may signal a resumption of the longer-term bull market. The pullback may be a great opportunity to enter or add to existing long positions if it does in fact occur. It’s possible that given the long period of price consolidation, like a coiled spring, when the rally takes place it may be sharp and without any significant corrections. The price target for the configuration once triggered, as measured from the head to the neckline on a weekly close basis, is in the $1700/$1715 zone, which also corresponds to the 78.6% retracement of the bearish correction from the all-time high in 2011 to the low in 2015.
TREASURY YIELDS AND WHITHER THE FED
To be fair, seasonality has tended to be favorable for gold from July to September over the past 30 years and can partially explain recent bullish performance. Furthermore, dollar weakness since June in particular has provided further support for gold prices.
Lower nominal and real Treasury yields since July have also provided a boost for the precious metal, as the market now sees less than a 45% probability of another rate hike by the Fed this year. Officially, the persistence of inflation below 2%, along with tepid wage growth despite continuously lower unemployment and decreasing slack in the labor market has led to the doves gaining the upper hand in the FOMC. In fact, current pricing of Fed Fund futures does not fully price in another hike until July 2019.
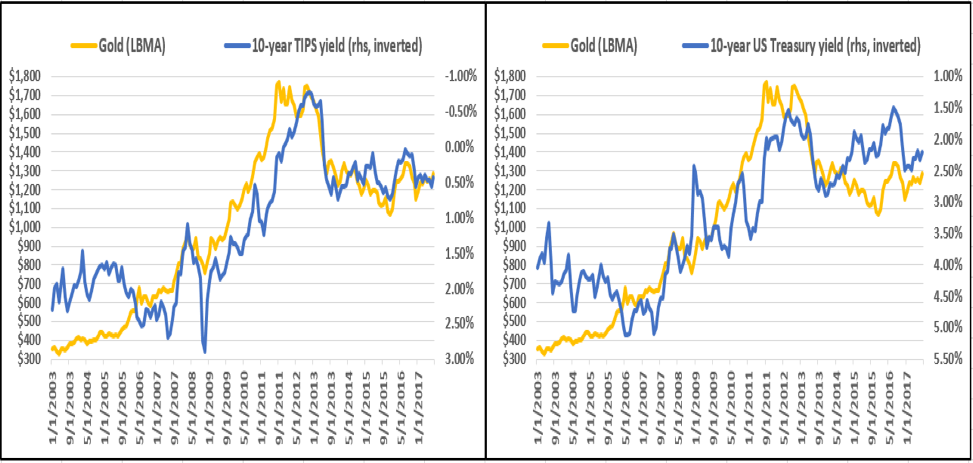
Source: FRED
Of course, uncertainty abounds, not least with regards to President Trump’s appointments to the Fed’s Board of Governors as well as the extent and speed of prospective balance sheet normalization. However, as things stand the Fed appears willing to err on the side of low interest rates even if it means falling behind the curve, and lower real yields continue to translate into support for gold prices.
CONCLUSION
Although a pause in the current rally can be expected in the short-term, the odds of a major new bullish acceleration for gold have increased considerably as recent technical developments have been clearly positive. In particular, the possible inverse head and shoulders pattern and related price target suggest the potential for a steep new upleg and the resumption of the long-term bull market. There is certainly no shortage of potential fundamental catalysts for such a move whether due to geopolitical, macroeconomic, or any number of other exogenous factors. What is becoming increasingly clear, from a technical perspective, is that the probability of an imminent major bullish acceleration has increased markedly over the summer.
Reproduction, in whole or in part, is authorized as long as it includes all the text hyperlinks and a link back to the original source.
The information contained in this article is for information purposes only and does not constitute investment advice or a recommendation to buy or sell.


