For the third consecutive time since the tightening cycle began in December 2015, gold rallied on the back of a Fed hike. In fact, in what resembled a relief rally, all asset classes reacted positively in the immediate aftermath of the Fed decision and the publication of the projection materials, which include the “dotplot”. Commodities, stocks, bonds, and emerging markets generally benefited as the US dollar sold off.
The initial euphoria may be at least partially attributable to what was perceived as a relatively dovish Fed, at least compared to market expectations. After Fed members clearly signaled the March hike in the weeks leading up to the meeting, markets became increasingly concerned about the possibility of a more-hawkish pace of four hikes in 2017, along with upward revisions in the forecasts for inflation and interest rates. In the absence of any significant changes to the projections and with three hikes penciled in for 2017, the USD and Treasury yields moved lower, credit and emerging market spreads tightened and equities and commodities rallied.
Chair Yellen And Inflation Overshooting
Particularly relevant for gold is the current discussion surrounding the symmetry of the Fed’s inflation objective. Neil Kashkari, the lone dissenting (dovish) vote of the decision, pointed out in a post last Friday (“Why I dissented”) that “based on our [FOMC’s] actions, rather than our words, we are treating 2 per cent as a ceiling rather than as a target.” However, during the press conference Chair Yellen acknowledged a willingness to tolerate temporary overshooting of inflation beyond 2%, pointing out that as “…a reminder, 2% is not a ceiling on inflation. It’s a target.” The statement, indicating a weaker USD and suggestive of potential lenience towards lower real rates, certainly appears positive for gold.
In addition, Chair Yellen also pointed out that while the Committee’s median longer run expectations of r* (the equilibrium real fed fund rate) stand at 1%, “some recent work suggests that, at the present time, the neutral real rate is lower than that. And some estimates place it around zero in real terms.” Given the importance of real yields as a driver of gold prices, particularly over the past few years, that comment and the related yield levels are also positive for the precious metal.
Real Yields Still Favoring Gold
For illustrative purposes, let us consider the yield on 10-year TIPS and its relationship with gold prices over the last 10 years. The diagram below demonstrates the high correlation between the two over the past decade.
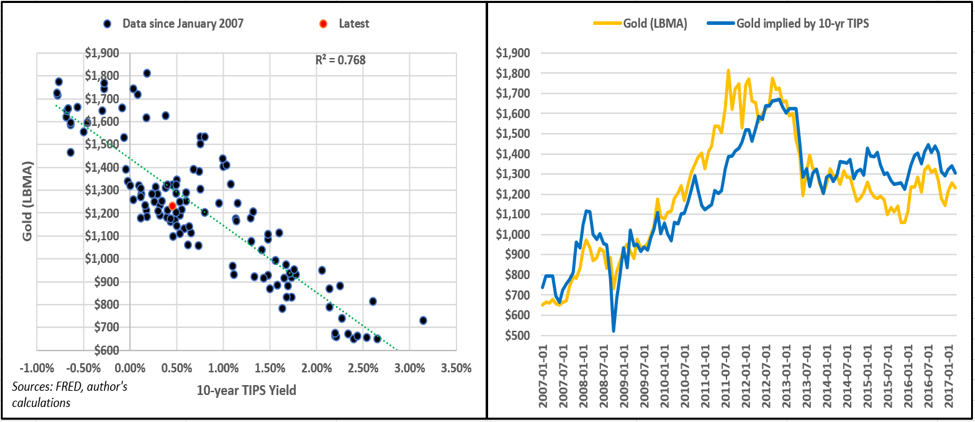
Using monthly data since January 2007, a simple linear regression indicates that a 1% yield would be consistent with LBMA gold prices around $1144.5, with a 99% probability (3-standard deviation) of prices trading in a range between $1062.6 and $1231.7. In other words, 10-yr TIPS yields would most likely need to rise above 1% to break the medium-term technical support level at $1045.4.
On the other hand, a real yield of 0% would be consistent with gold at $1437.9, with a 99% probability of prices ranging between $1392.4 and $1483.4. The current yield, around 0.50%, is consistent with LBMA gold prices at $1292.8.
Technicals: Positioning And Confirmation Pullbacks
In terms of positioning, Comex gold prices came under pressure in the run up to the Fed as money managers reduced exposure ahead of the decision. In the week from March 8th to March 14th, open interest in futures and options dropped by more than 44k. The net long position fell to just below 50k for the first time since January, compared to an average of over 120k contracts since June 2006 and the Brexit-induced record of nearly 287k set last July.
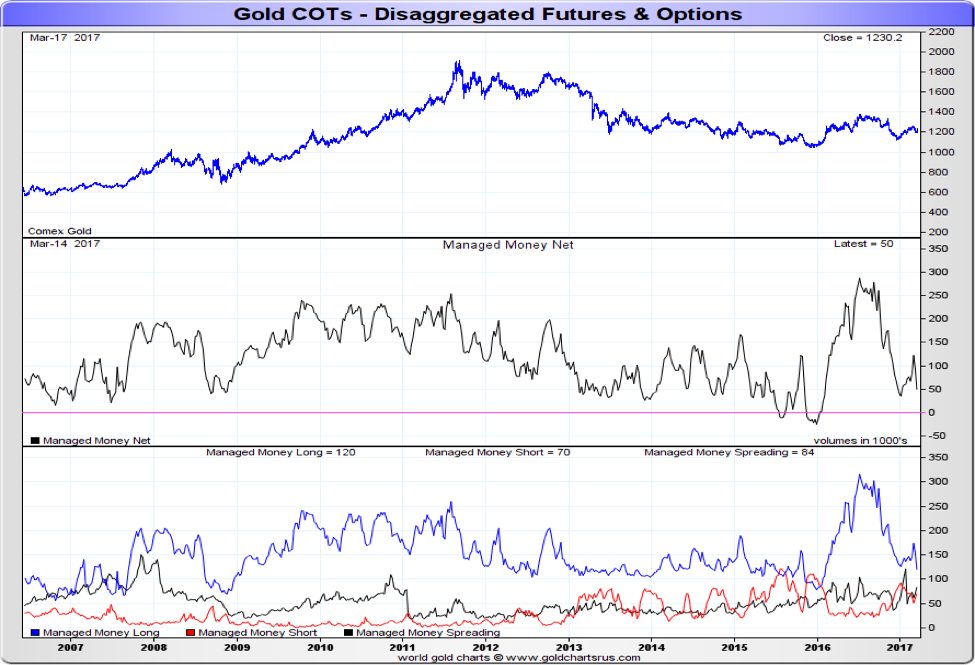
Source: www.goldchartsrus.com
Considering open interest on futures contracts only, current net long positioning compared to the last 52-weeks is low. This may be interpreted as a positive sign for bulls, as it provides plenty of “ammunition” for a new uptrend.
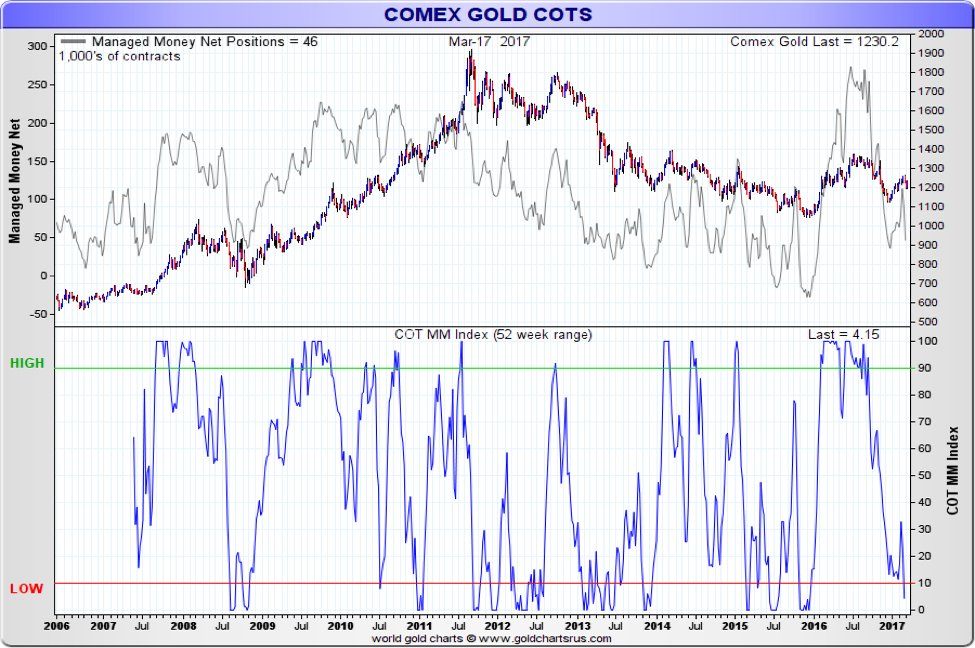
Source: www.goldchartsrus.com
The above appears even more compelling in light of a possible inverse head and shoulders pattern under development on a daily chart, as depicted in the chart below. A breach of the neckline resistance around the $1378 level would provide impetus for a new and significant upleg, as the configuration would currently imply a potential target around $1703.
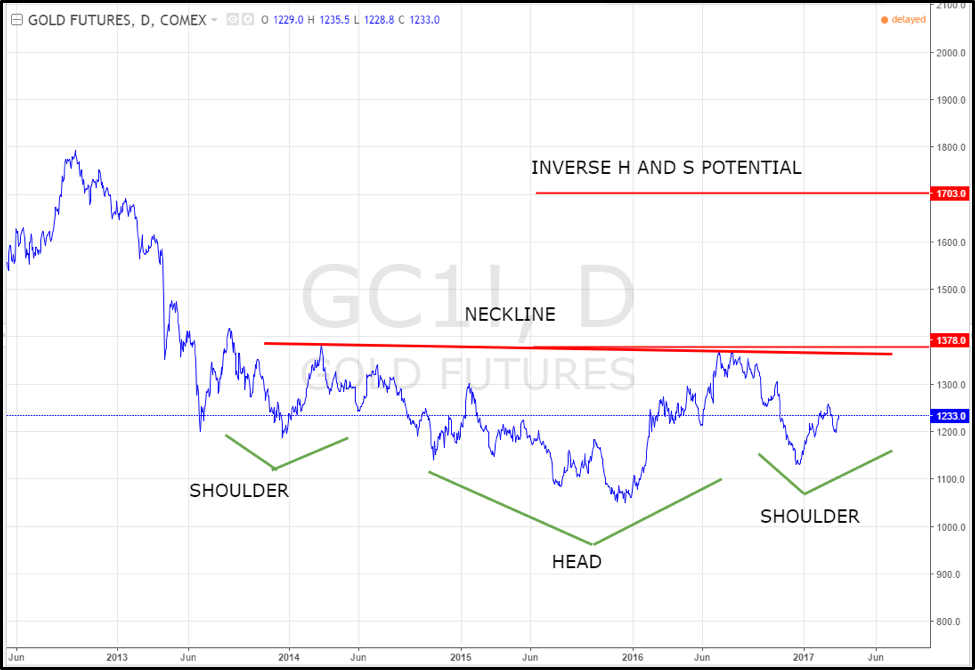
Source: www.tradingview.com
In the shorter-term, key Fibonacci levels corresponding to 61.8% retracements at $1281 and $1177 respectively provide important resistance and support. Confirmation pullbacks to previous trendline resistances on both prices and the RSI since the bounce following the Fed appear as positives, leaving gold poised to shape a new upleg and test $1281 in coming weeks.
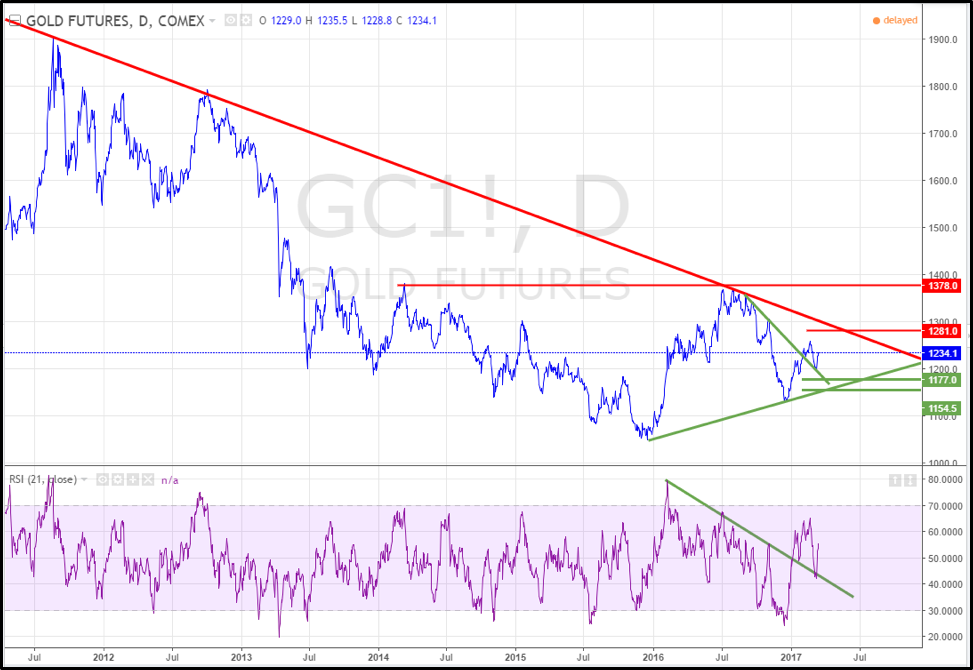
Source: www.tradingview.com
Reproduction, in whole or in part, is authorized as long as it includes all the text hyperlinks and a link back to the original source.
The information contained in this article is for information purposes only and does not constitute investment advice or a recommendation to buy or sell.


