Gold Finally Poised to Outperform US Government Debt?
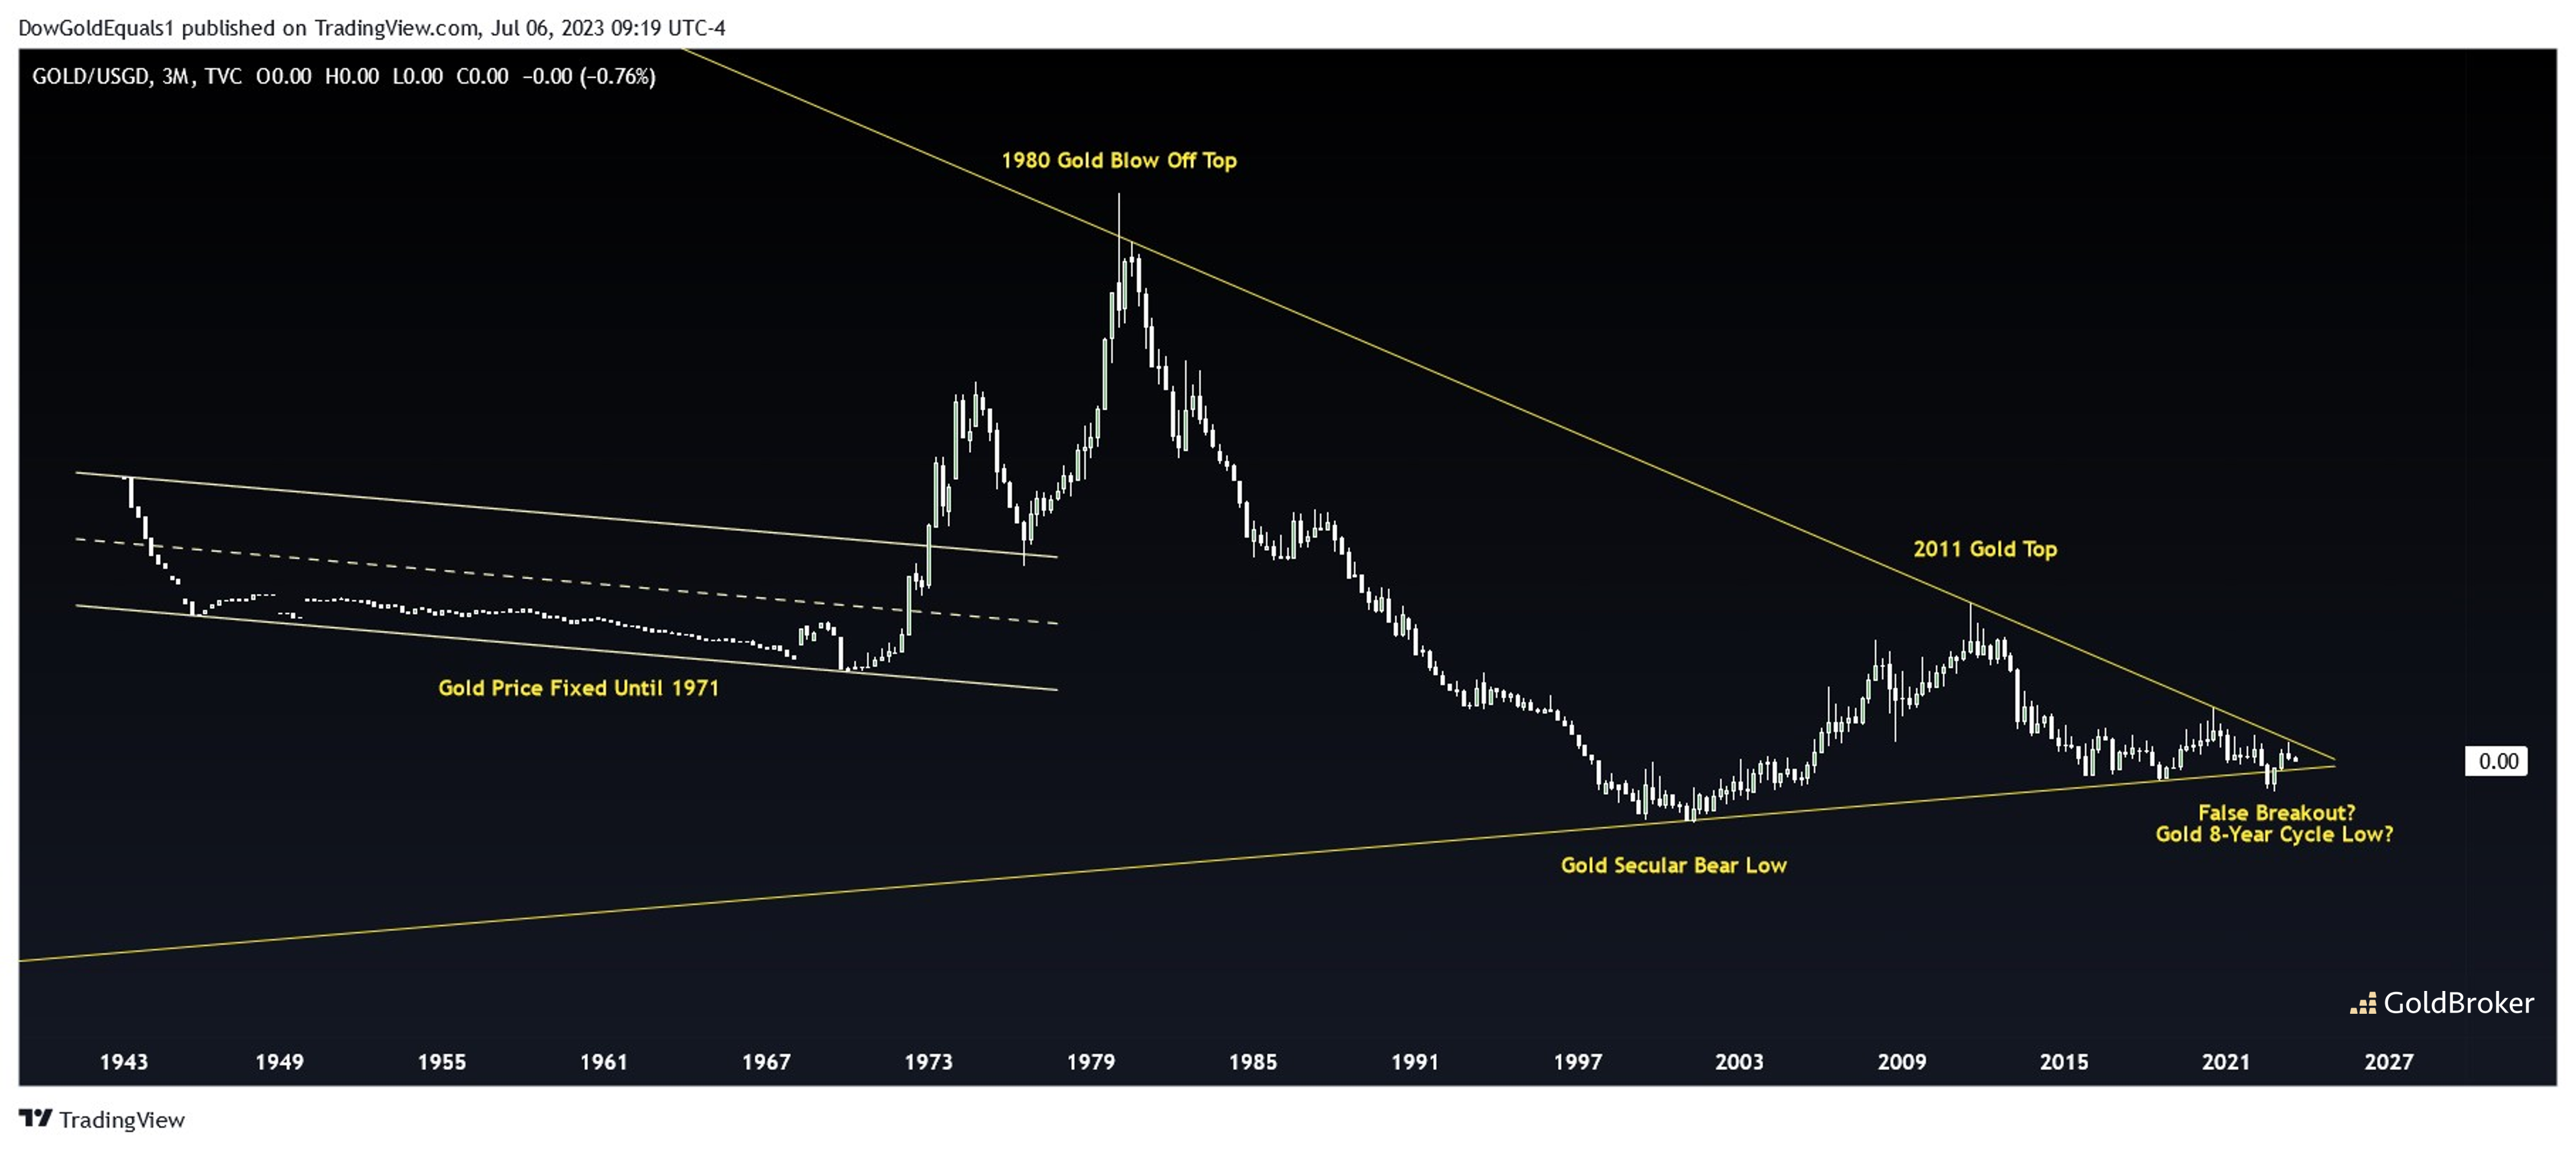
This 80-year chart of Gold's performance relative to US Government Debt paints a fascinating picture of Gold's past price action and suggests that a very large move could be brewing over the next several years. First note that this ratio was basically flat-lined until 1971 when Gold began trading freely. Interestingly, once the ratio broke free of its descending parallel channel, it backtested nearly perfectly during Gold's bull market retrace in 1976. This ratio began to consolidate into a HUGE wedge following Gold's historic top in 1980. A false breakdown in September, 2022 strongly supports Gold's 8-year cycle low is in, and now the ratio finds itself nearly at the apex of the wedge. Often when price coils into the apex of a wedge pattern, the resulting breakout can be impulsive. Given the false breakout we experienced to the downside, the next breakout is expected to be higher.
Gold vs. US Money Supply on the Launchpad?
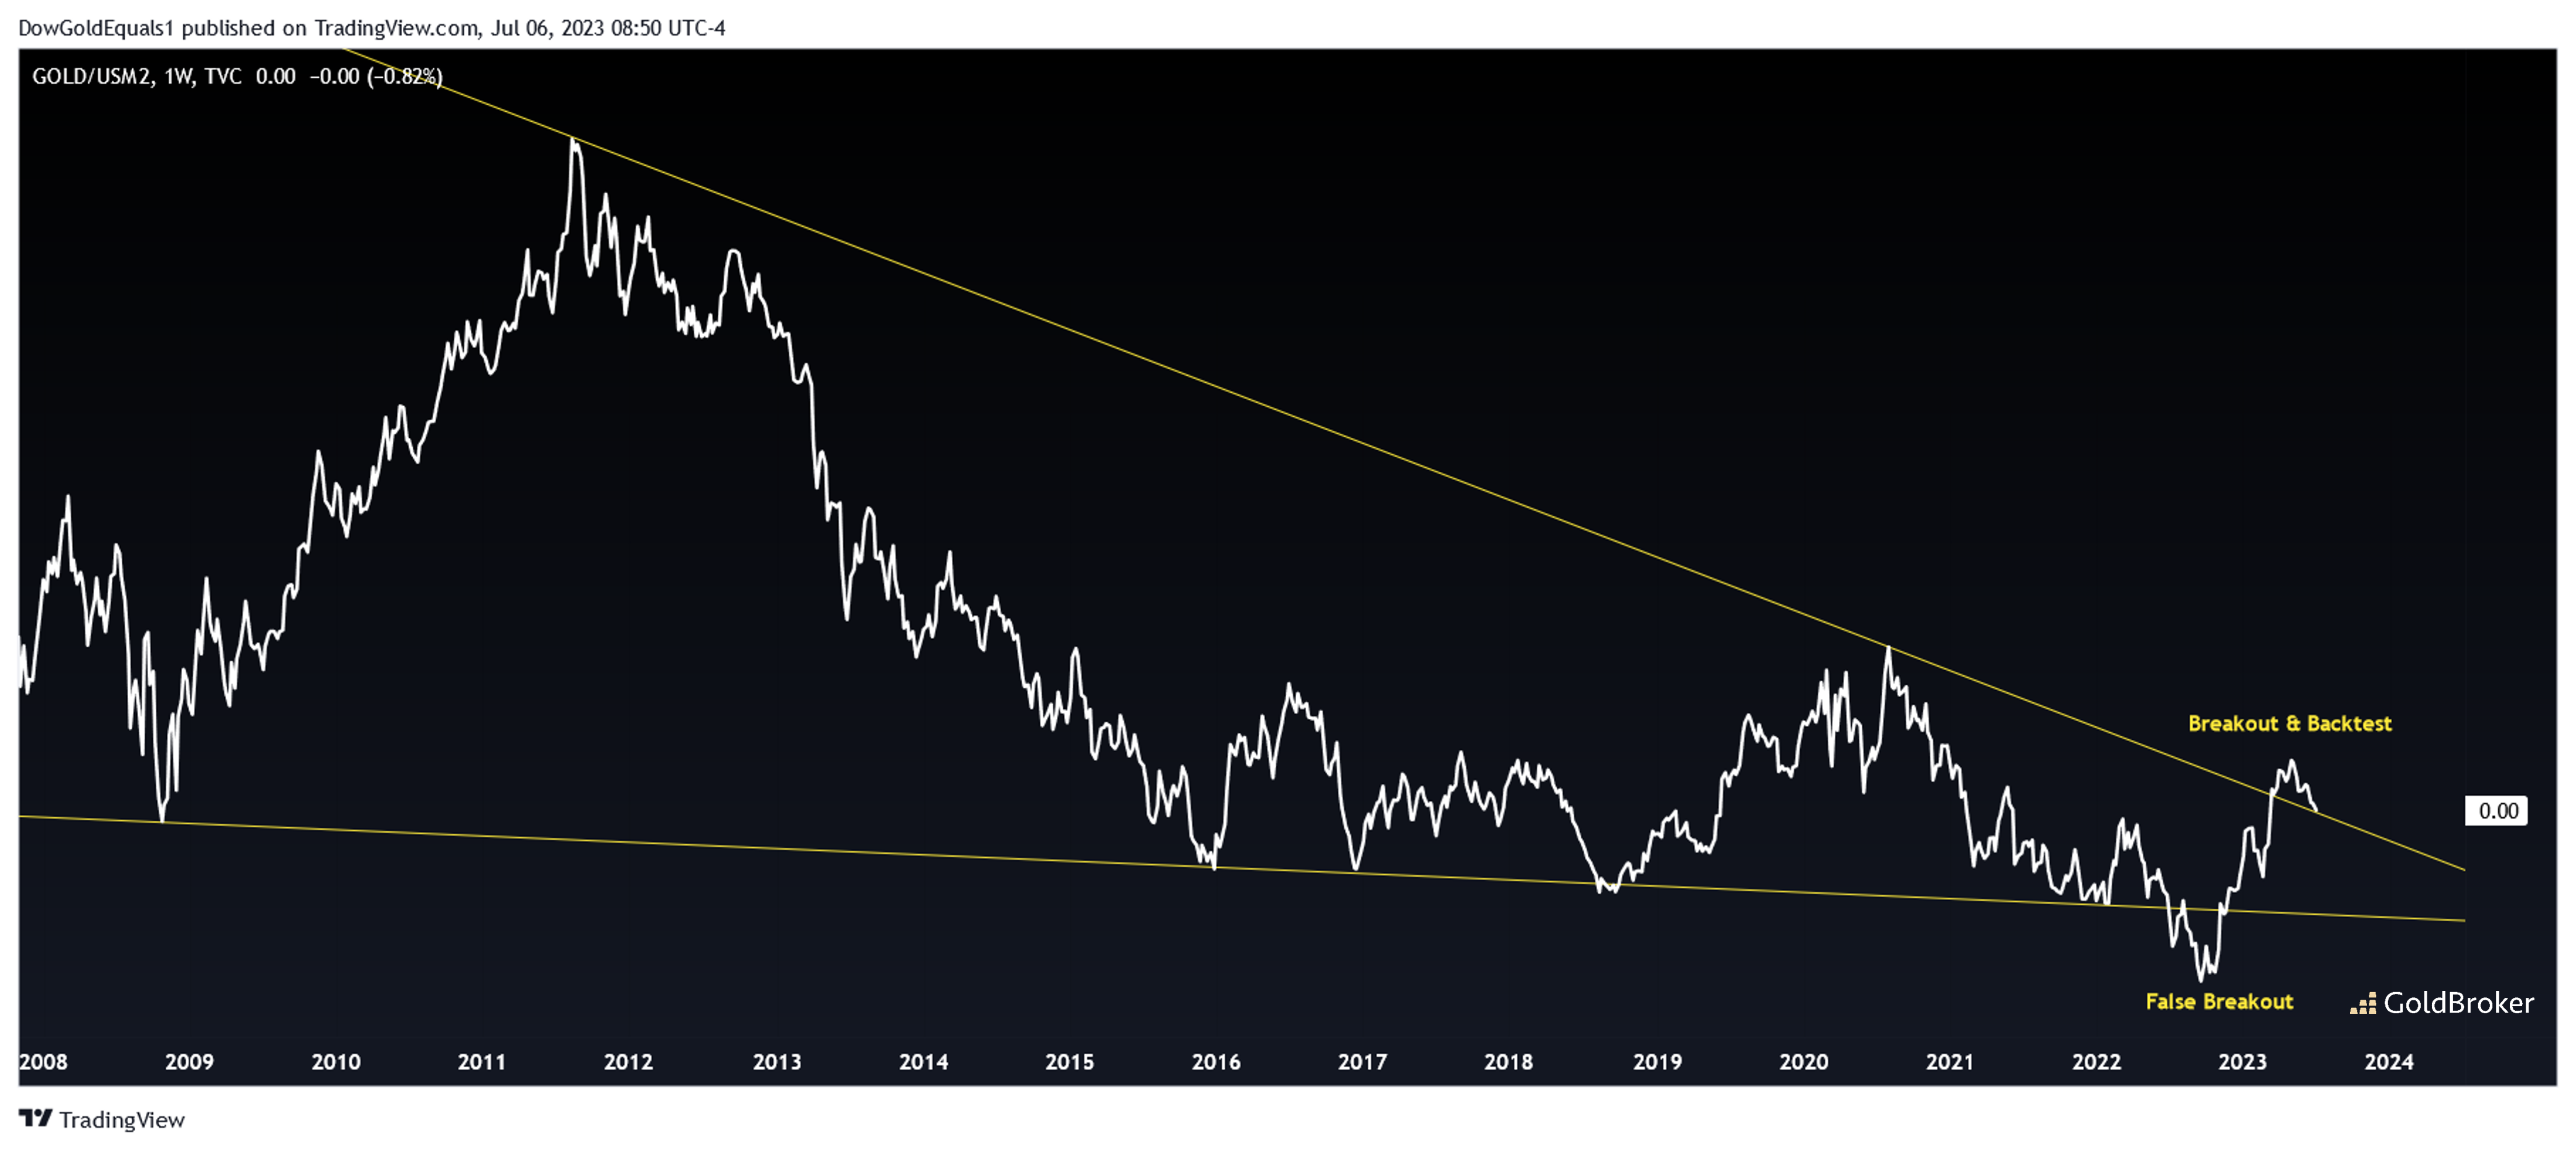
The ratio of Gold price to the US Money Supply has also created a large wedge trading pattern over the past 15 years. This too also experienced a false breakdown, but it has also already broken out to the upside and is now backtesting the wedge. This is the price action we expect to see next with Gold/Debt. This is extremely healthy bull market action from a technical standpoint. Over the coming years, we would expect this pattern to resolve with Gold strongly outperforming Money Supply, which would mean that Gold would appreciate in both nominal and real terms.
Reproduction, in whole or in part, is authorized as long as it includes all the text hyperlinks and a link back to the original source.
The information contained in this article is for information purposes only and does not constitute investment advice or a recommendation to buy or sell.


