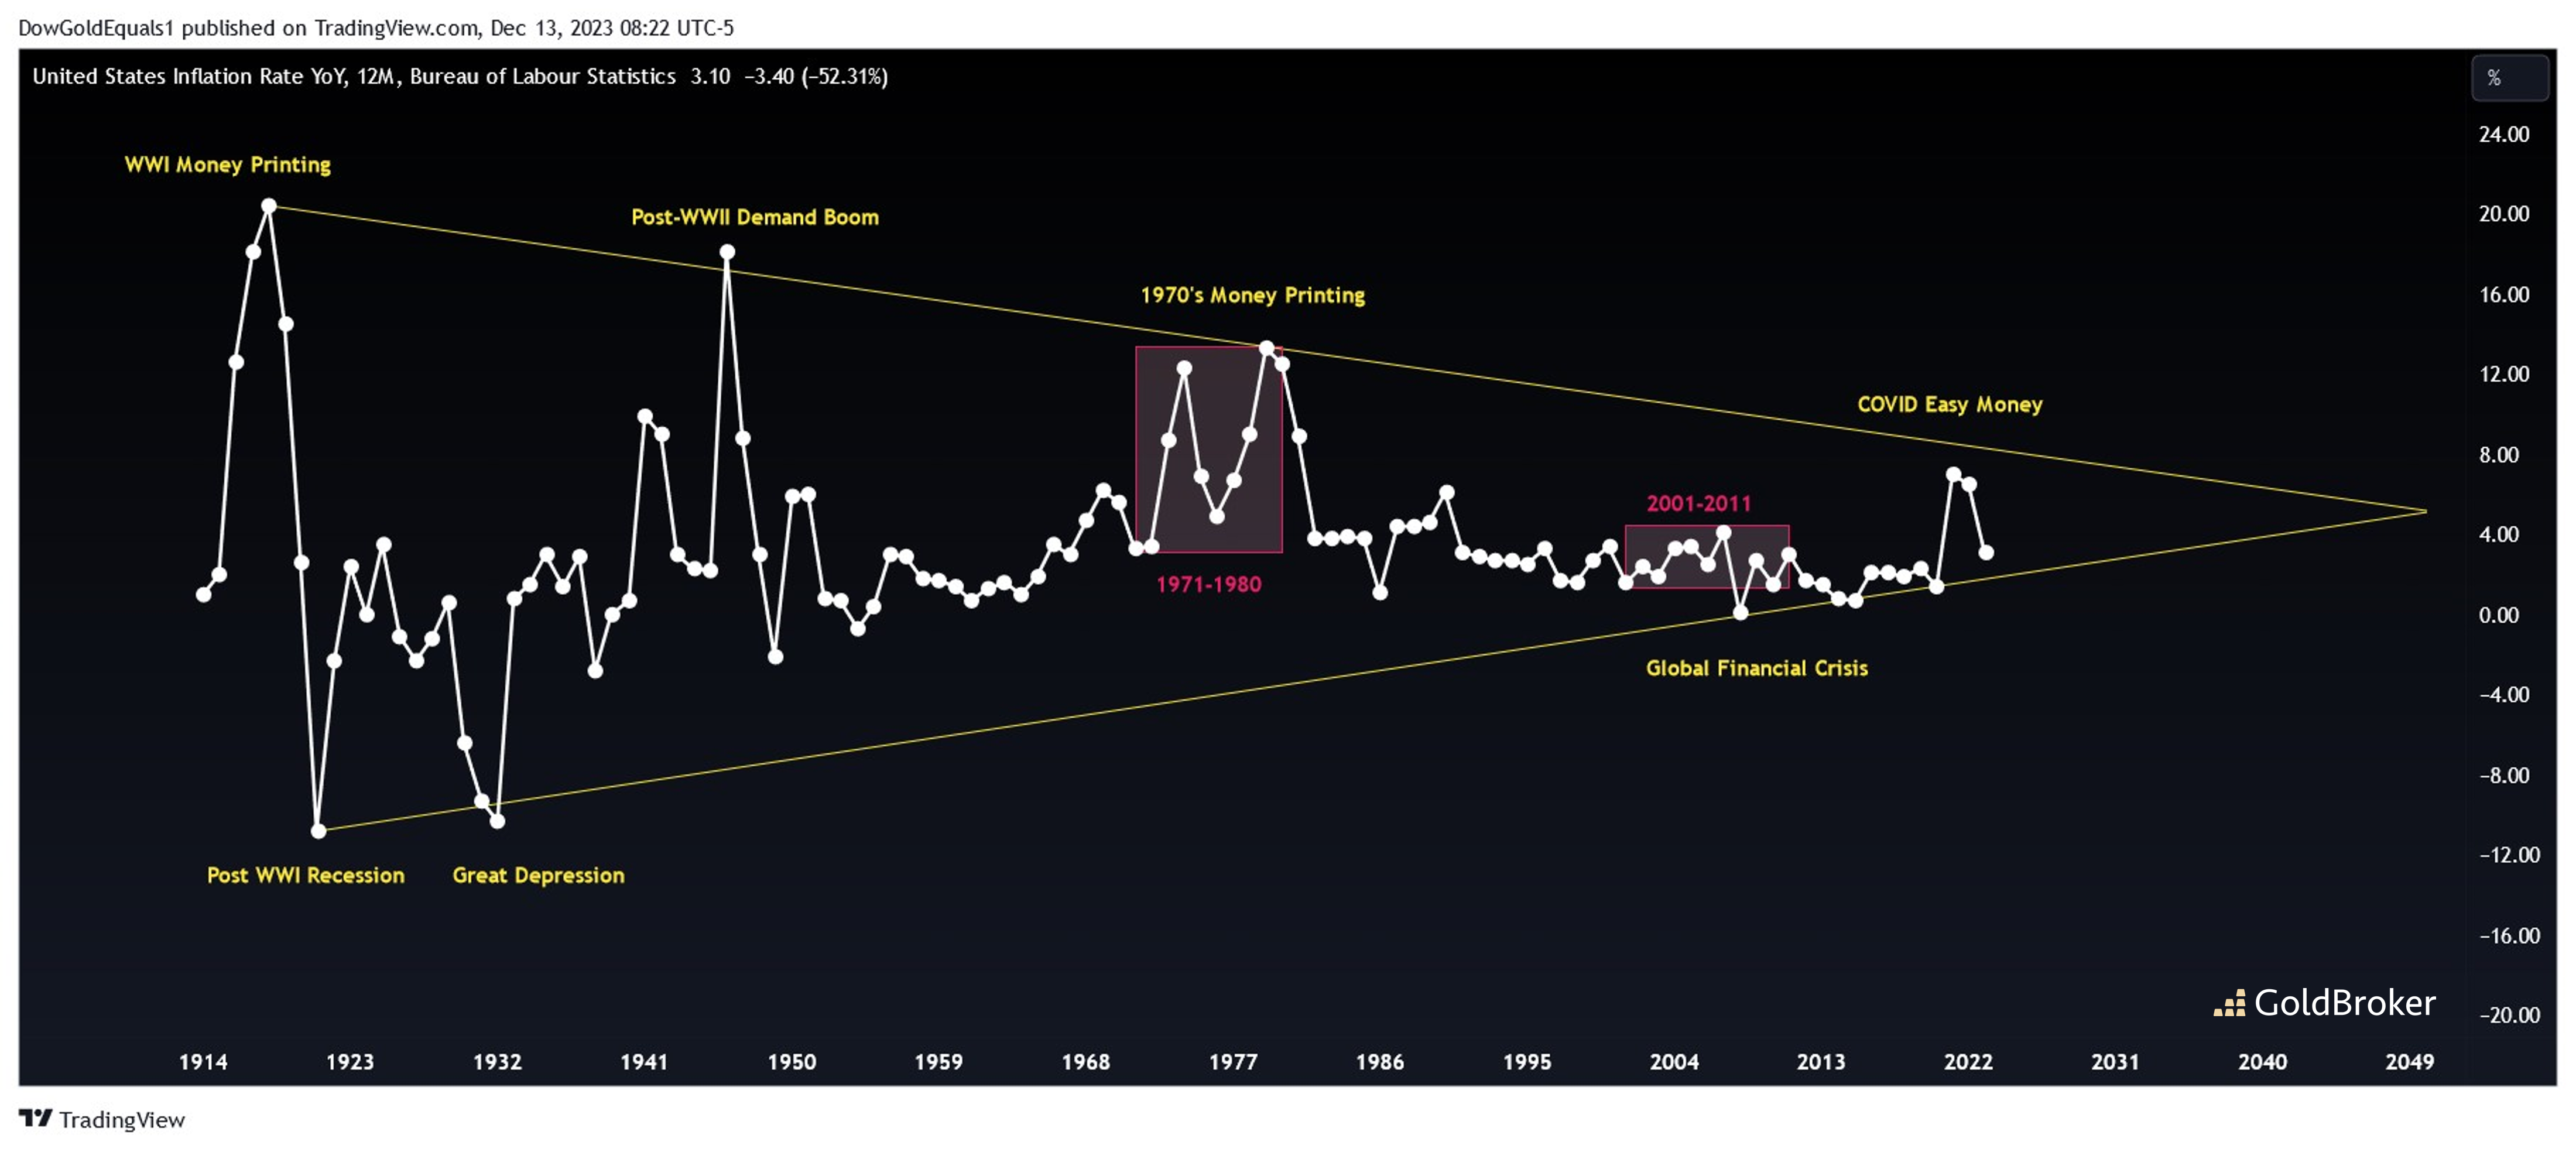
This week we'll look at the fascinating 100-year chart of the United States Inflation Rate as well as long-term charts of inflation-sensitive Silver and Oil to see if we can find clues about where inflation could be headed next. Beginning with the US Inflation Rate, you may be surprised to see that its chart too conforms to the technical patterns seen in virtually all other trading instruments - in this case a 100-year wedge. Interesting to note is, that despite the hysteria created by the inflation of the COVID-era, it paled in comparison to that of the 1970s, of which that too was dwarfed by the inflation of Post-WWII and Pre-WWI. But where will this chart break to next: up, down or will it merely meander around 4-5% into the wedge apex over the next 25 years?!
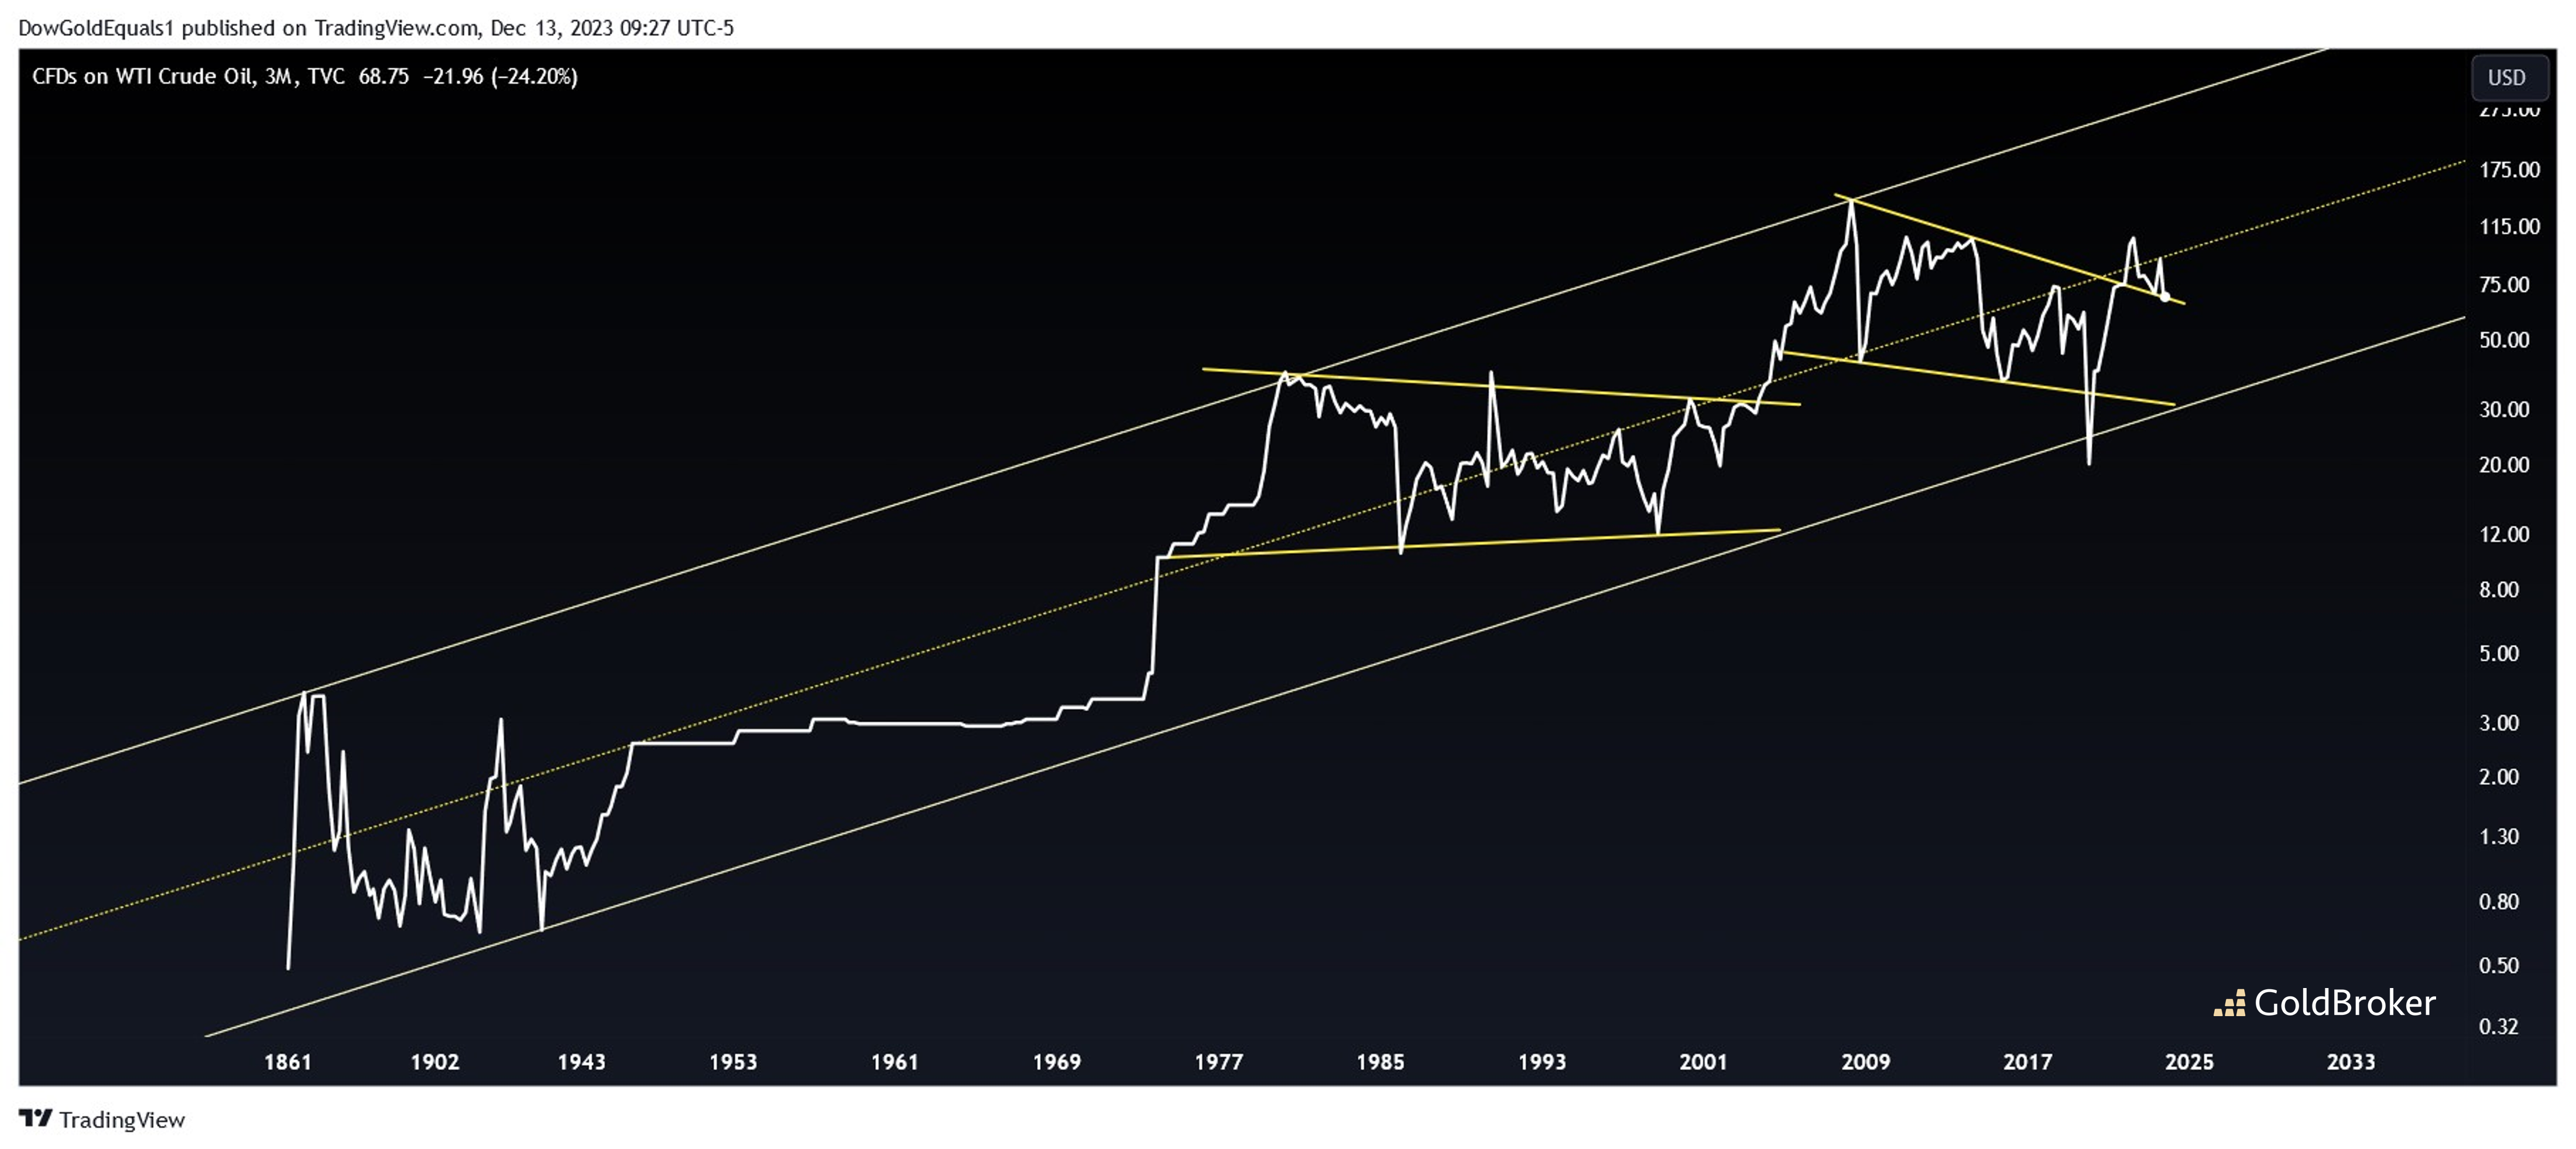
Once clue might be provided by the long term chart of Oil. Astoundingly, the entire trading history of oil can be defined as one big ascending channel going all the way back to the mid-19th century. However, within that channel have occurred a couple of significant consolidations, including the one currently being backtested. If the backtest holds, oil could be poised to rocket higher from here - indicating that inflation may indeed be set to rise dramatically.
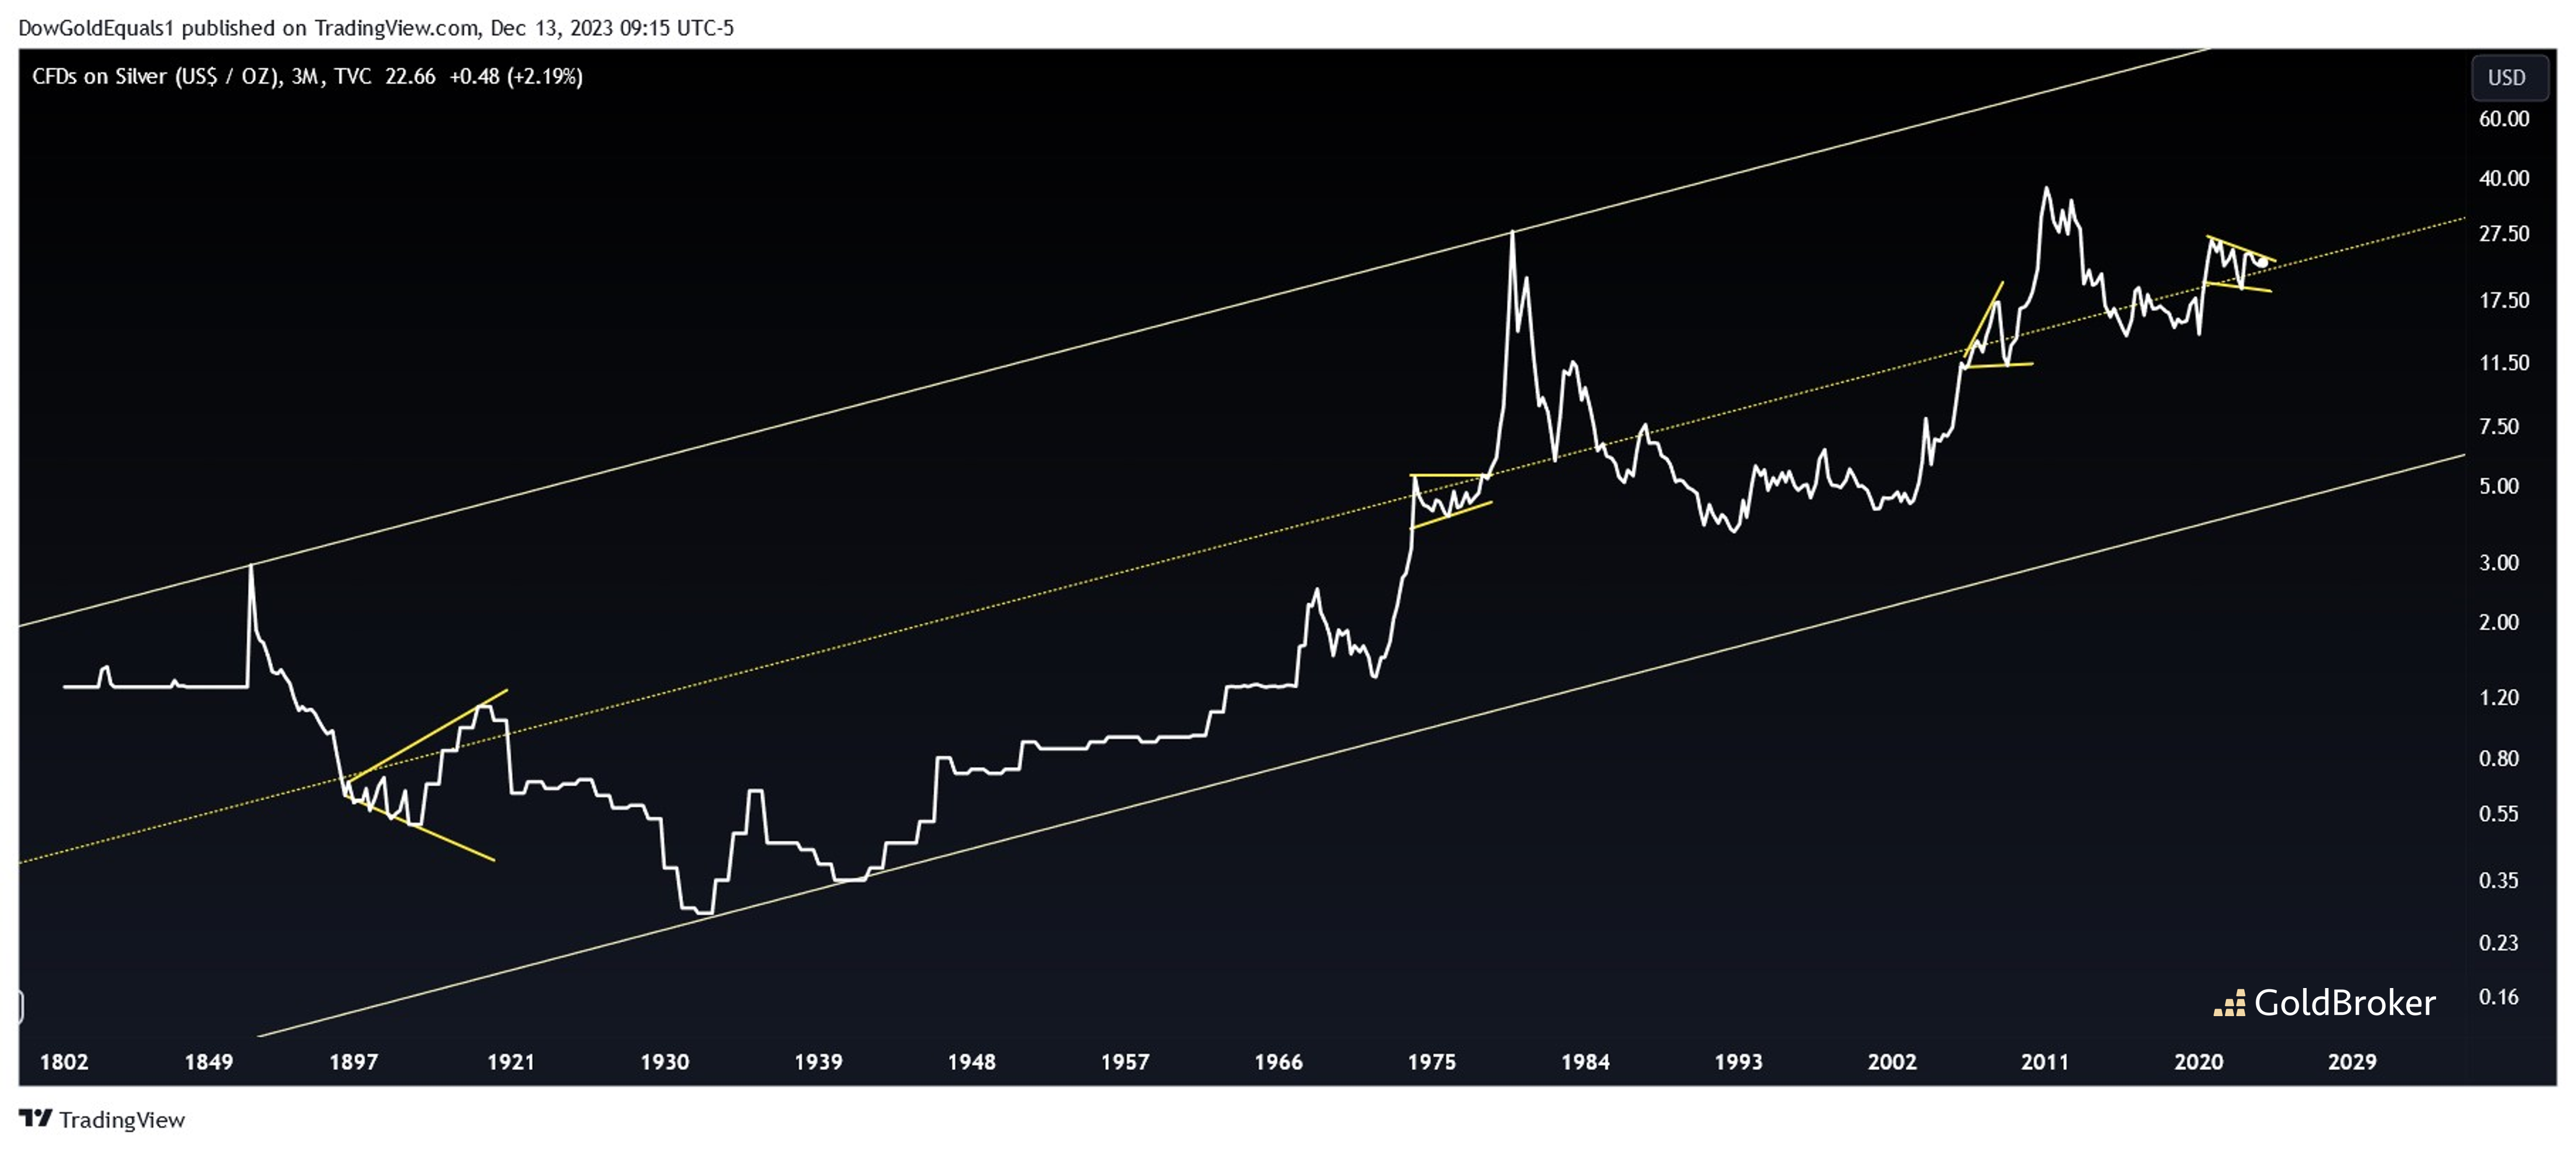
Another clue comes from the long term chart of Silver, which too can be defined as a very large trading channel. While this channel may be scoffed at by traders who find the length and breadth so large as to make it inactionable, it may still be constructive to note how price has interacted with its midline. Currently, price is making its 4th consolidation around the midline, and the previous three have resolved in very meaningful moves in price. The first one was a huge breakdown, corresponding to the massive deflation of the Great Depression, and the second was a breakout that corresponded to the big inflation in the 1970s. The current consolidation appears to be a bull flag, which may portend another round of big inflation to come.
Reproduction, in whole or in part, is authorized as long as it includes all the text hyperlinks and a link back to the original source.
The information contained in this article is for information purposes only and does not constitute investment advice or a recommendation to buy or sell.


