After a challenging Q4 in 2016 in a context of rising bond yields and a stronger US dollar, gold seems to be getting its shine back in Q1. The technical picture is beginning to look a little more constructive and the “reflation trade”, spurred on further by expectations of higher infrastructure spending and tax cuts in the US, has thus far also benefited gold.
From a technical perspective, there are indications that the low at $1045.40, incidentally printed just ahead of the first Fed hike in December 2015, was significant and now provides medium-term support as indicated by the price channel in the chart below.
The zone provided significant resistance in 2008 and throughout much of 2009, and following the upside breakout provided solid support on the pullback in early 2010. It also corresponds to the 50% retracement of the uptrend from the July 1999 low at $253.2 to the high at $1923.7 in September 2011. Yet another reason that low appears significant is the presence of a bullish RSI divergence, as depicted by the blue lines: a very useful signal for technical analysts and contrarian investors, RSI divergences often indicate trend reversals.
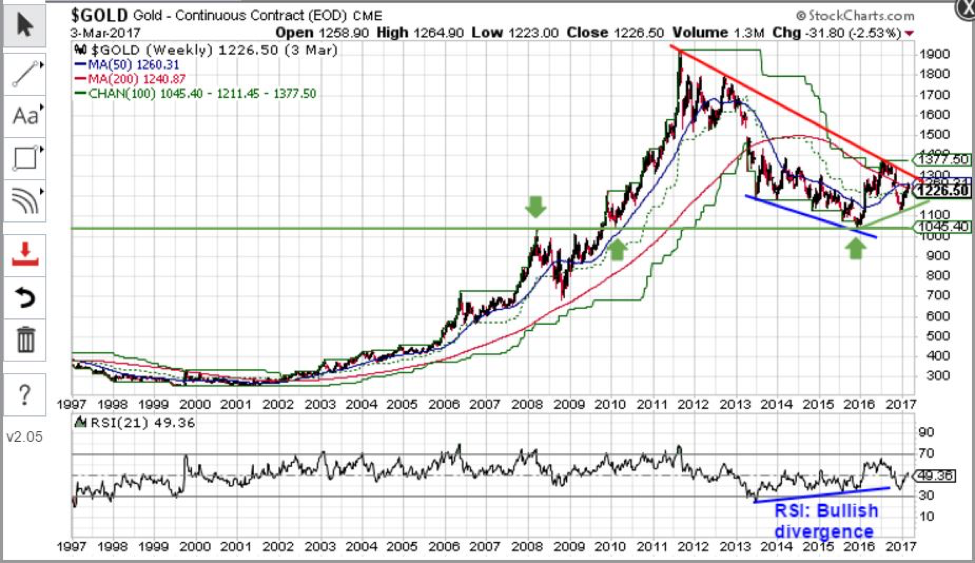
Source: StockCharts.com
Another positive development in terms of price action is the bullish crossover signal of the 50- and 200-week simple moving averages, for the first time since 2002. This signal, however, is only a prerequisite for a new uptrend, and resistances at $1275/$1280 and especially $1377.5 must be breached to confirm an upside breakout from the current range. In the shorter-term, $1211 provides support, followed by $1177 and $1154. Only a break below the $1124.3 low would confirm a bigger correction to $1045.40, which as previously mentioned currently stands as medium-term support.
In terms of the Fed, as the probability of a March hike rose to nearly 80% as of last Friday’s close, some downward price pressure in the run-up to decision on March 15 is certainly not inconceivable and should be expected. As illustrated by dovish FOMC member Brainard’s speech on Wednesday, along with several speeches and comments by other members last week (Kaplan, Harker, Williams, Lacker, Dudley, Mester, Powell, and Yellen herself), recent jawboning has been hawkish, which may weigh on gold prices ahead of the decision and lead to a test of the technical supports.
Importantly, a potential hike by the Fed this month need not necessarily deter the resumption of the uptrend since “lift-off” began: since April 1968, for instance, for any given month in which effective fed fund rates rose, gold rallied more than 50% of the time. Although the next hike may be indicative of a potential quickening in the pace of tightening, the cycle itself need not necessarily spell carnage for gold prices.
For instance, during the tightening cycle between June 2004 and June 2006, when Fed fund rates rose from 1% to 5.25%, gold prices rallied some 50%. Following the first hike of this cycle on December 16th 2015, prices rose from $1071.5 to $1234.5 by the end of following quarter (Q1 2016), for a gain of more than 15%. Gold also rallied following the second Fed hike on December 14th 2017, when the metal closed at $1144.6, rising to nearly $1260 last week.
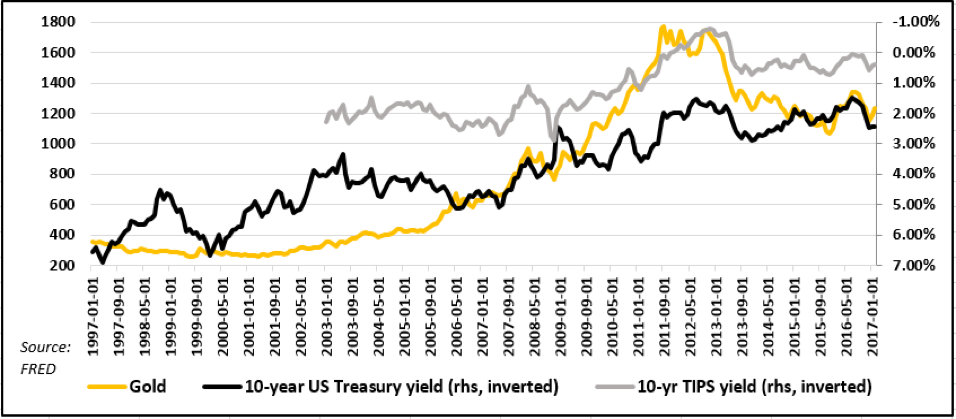
Additionally, coming off a zero-lower bound regime, this is an abnormal monetary tightening cycle. Money supply is near record highs after three rounds of QE, yields broadly remain near record lows and, not least given potential trade wars and significant fiscal stimulus, the US dollar may well remain subdued under the Trump administration. Combining these three variables (M2, 10-year US Treasury yields, and the Fed’s Broad US dollar index) yields an interesting metric with which to compare gold prices over the long-term.
The negative relationship between gold and 10-yr nominal Treasury yields over the past 20 years is particularly interesting, as is the correlation between real yields and gold over the last 10 years. Currently, 10-yr real yields suggest gold prices may be slightly undervalued.
Contemplating a longer period and using M2, 10-yr nominal yields and the Broad USD index as independent variables going back to January 1973, a statistically significant multiple regression currently implies gold prices of around $1600.
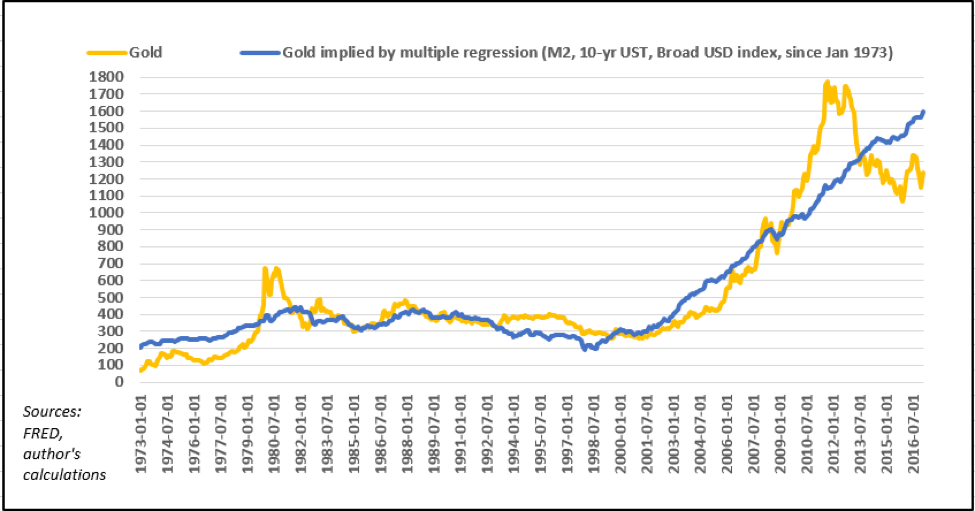
Perhaps more importantly, there are no signs of a trend reversal in this indicator yet, suggesting a continued positive environment for gold. In other words, selling pressure ahead of the Fed may yet provide some interesting opportunities in the short-term for those investors looking to buy gold with a longer-term horizon.
Reproduction, in whole or in part, is authorized as long as it includes all the text hyperlinks and a link back to the original source.
The information contained in this article is for information purposes only and does not constitute investment advice or a recommendation to buy or sell.


